Crop Production
When managing thrips in cotton, prevention is one of the first lines of defense in an integrated pest management program. Prevention is an easy, cost-effective form of pest management. Tools, such as the Thrips Infestation Predictor for Cotton from North Carolina State University, are reliable indicators of thrips pressure and helpful for planning out a pest management program.
Planting
The Thrips Infestation Predictor does not tell producers when they should or should not plant. It instead calculates the predicted risk of thrips injury at the time they plant. Using weather data, the predictor creates models to predict dispersal times of thrips and cotton growth affecting seedling susceptibility. It then predicts the injury risk resulting from these two factors occurring at the same time.
Ideally, planting would be planned around pest activity, but that is not always practical. When possible, producers can alter their planting dates based on the model. If not possible, producers can use the model to plan for field scouting and to apply a foliar spray if they are at a high risk of injury. The goal of thrips management is to protect cotton from emergence to the fourth or fifth true-leaf stage. At this point, cotton is past the window of susceptibility.
Using the Predictor
To create a model, go to the home page of the predictor. There, input the following information:
- projected planting date
- location (This can be an address or coordinates. You can also scroll on the interactive map and drop a pin at the location.)
- request a five, seven, or 10-day window before and after the anticipated planting date
After entering the information, click submit. This will show how the risk changes across that period of time. Producers can use the same location for their entire farm because the model uses local weather station data. Entering the location of each field is not necessary.
Once the model is complete, a new page will display several graphs that help visualize the risk of thrips injury to the one through four true-leaf cotton stages at that location.
The first graph shows the risk of injury based on previous years weather data and the expected weather patterns for this year. This can only project up to two weeks out from your planting date because the models rely upon weather forecasts. Weather forecasts can change often so it is recommended to check the model every few days to make sure no major changes have happened. It is suggested to run the model
- weekly until the cotton is planted
- the day of or the day after it is planted
- regularly until the cotton is past the fourth true-leaf stage
Example
In this example, a planting date of April 10 with a 10-day window has been selected for the Prattville Agricultural Research Unit. Note. The larger the window selected, the more dates the model will show.
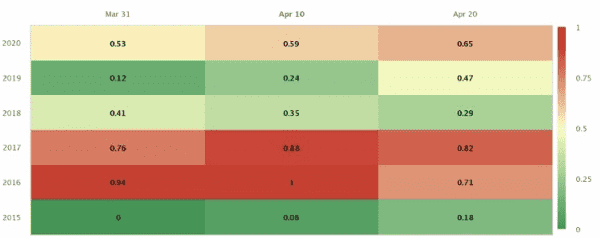
Figure 1. Relative thrips injury risk over the current and preceding five years.
Figure 1 shows the relative thrips injury risk for this year and the last five years. The preceding five years are provided so producers can assess the model’s performance at that location based on their experience and farm records.
The scale from 0 to 1 indicates the chance of thrips injury. The closer to 1 (dark red), the greater the chance. The closer to 0 (dark green), the less the chance. Producers will want to plant when there is some shade of green if possible. If planting in the red area, prepare to spray for thrips.
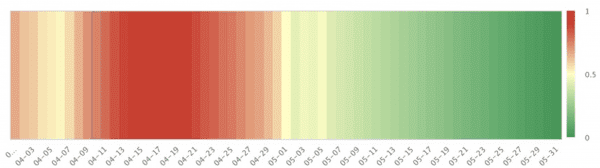
Figure 2. Relative thrips injury risk between April 1 and May 31, 2020.
Figure 2 shows how the relative risk of thrips injury changes during the cotton planting window (early April through the end of May). In the model, there will be two figures displaying this information. One thing to keep in mind is that the severity of this year’s risk is relative to this year only and not to the risk observed in the previous five years.
For example, in Figure 1 the most severe thrips injury encountered for a March 31 planting date was in 2016 and the least severe was in 2015. Producers should not use this graphic to assign an actual injury rating in any of these years. In other words, red does not correspond with an injury rating of 5 on a 0-5 scale.
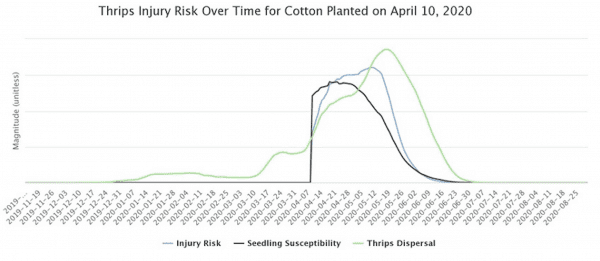
Figure 3. Thrips injury risk over time for cotton planted on April 10, 2020.
Figure 3 displays how the windows of susceptibility for cotton (black line) and when the field will be infested (green line) line up against each other. The blue line shows how overlap in these two time periods identifies when and how much the risk of thrips injury increases. This shows what the window of susceptibility is for this year and is not relative to any other year.
If the young crop is at a growth stage susceptible to thrips injury when the thrips flight is occurring, that is when producers need to monitor injury and consider making a management intervention, especially during the peak of the flight.
Figure 3 can also be used to provide insights on thrips movement into other crops as well. The thrips model in the Thrips Infestation Predictor is being used to make thrips management decisions in tobacco in North Carolina and could also be relevant for crops like peanuts.