
Farming

Rainwater harvesting can significantly reduce municipal water used on broiler farms, supplying more than half of the annual water demand on a North Alabama farm case study while lowering water costs by approximately 54 percent. Success depends on proper system design, maintenance, and local water economics.
Rainwater harvesting (RWH) continues to be discussed as a potential tool to help broiler producers manage rising water costs while maintaining a reliable supply for production. Water is essential in broiler houses for both drinking and evaporative cooling, and total annual demand for a four-house farm can exceed several million gallons. In areas where municipal water rates continue to increase or wells are limited in capacity or quality, alternative water sources are being explored.
Municipal water rates in Cullman County, Alabama, have increased substantially over the past decade, creating additional economic pressure for broiler producers who rely on purchased water. Reported rates rose from approximately $9.50 per 1,000 gallons in 2015 to about $16.10 per 1,000 gallons in 2025, representing roughly a 69 percent increase over that period. This steady rise in water costs has increased production costs for farms that depend on municipal supply and has driven interest in alternative water sources such as rainwater harvesting. Because broiler operations require large volumes of water, especially during summer flocks when evaporative cooling demand is highest, even relatively small increases in cost per 1,000 gallons can have a meaningful impact on overall production costs.
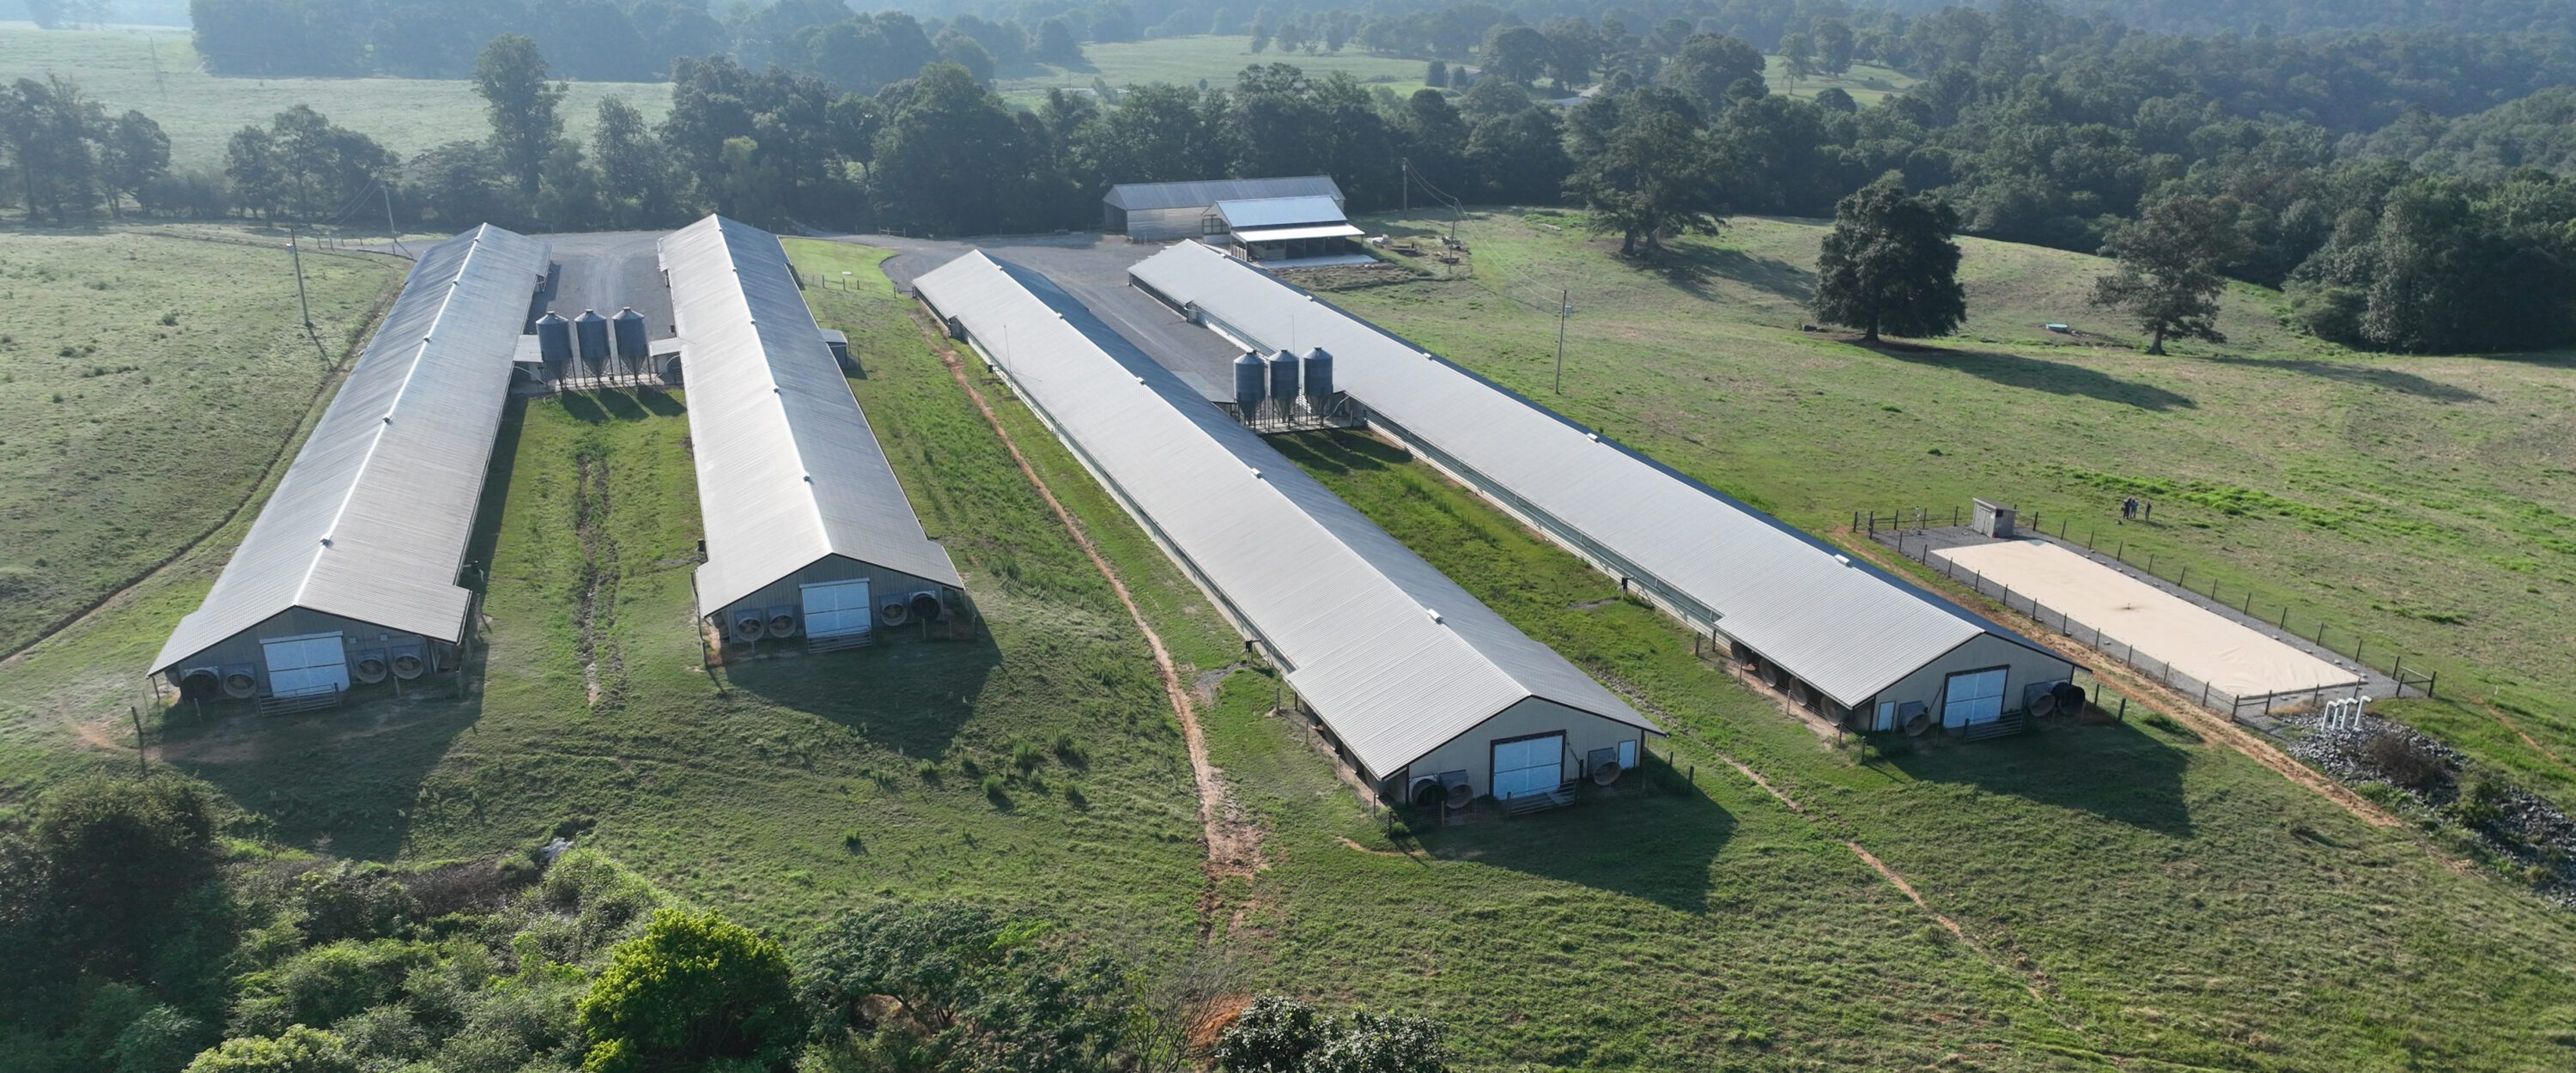
Rainwater harvesting systems capture rainfall from broiler house roofs, store it, and make it available for later use (figure 1). A commercial-scale system typically includes roof gutters, downspouts, prefilters, collection piping to funnel captured water into storage and some level of water treatment and/or disinfection depending on water use (figure 2). In the system evaluated here, rainfall collected from four broiler houses with a combined roof area of approximately 82,000 square feet (about 1.9 acres) was collected and stored in a flexible storage bladder with a capacity of 100,000 gallons. A 1-inch rain event would generate a gross water volume of 52,000 gallons of rainwater that the system could capture.
Click on the images below to see them at full scale.
-
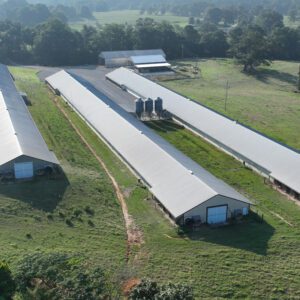
- Figure 1. Aerial view of a four-house commercial broiler farm on terrain that slopes from highest to lowest points. The storage bladder is on the lowest terrain.
-
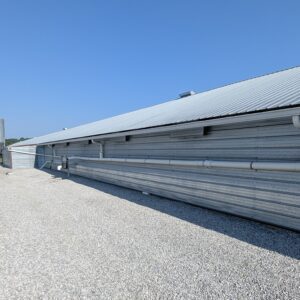
- Figure 2. Rainwater is collected with gutters that feed through downspouts into collection piping. The black cylinder is a centrifugal prefilter that removes large debris before sending the water into underground piping to a storage bladder.
-
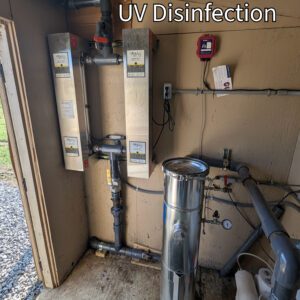
- Figure 3A. Inside the system control room, water is filtered through a bag filter to remove small particles before being disinfected through two ultraviolet (UV) lights.
-
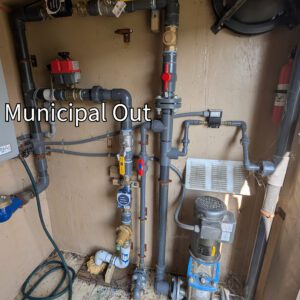
- Figure 3B. Control valves are used to select between stored rainwater, when available, and municipal water for the four broiler houses.
Captured rainwater was filtered to remove debris, disinfected with ultraviolet (UV) light, and pumped back to the broiler houses (figure 3) for drinking water and evaporative cooling use. The system was designed to automatically supply rainwater when available and switch to municipal water when storage levels were low.
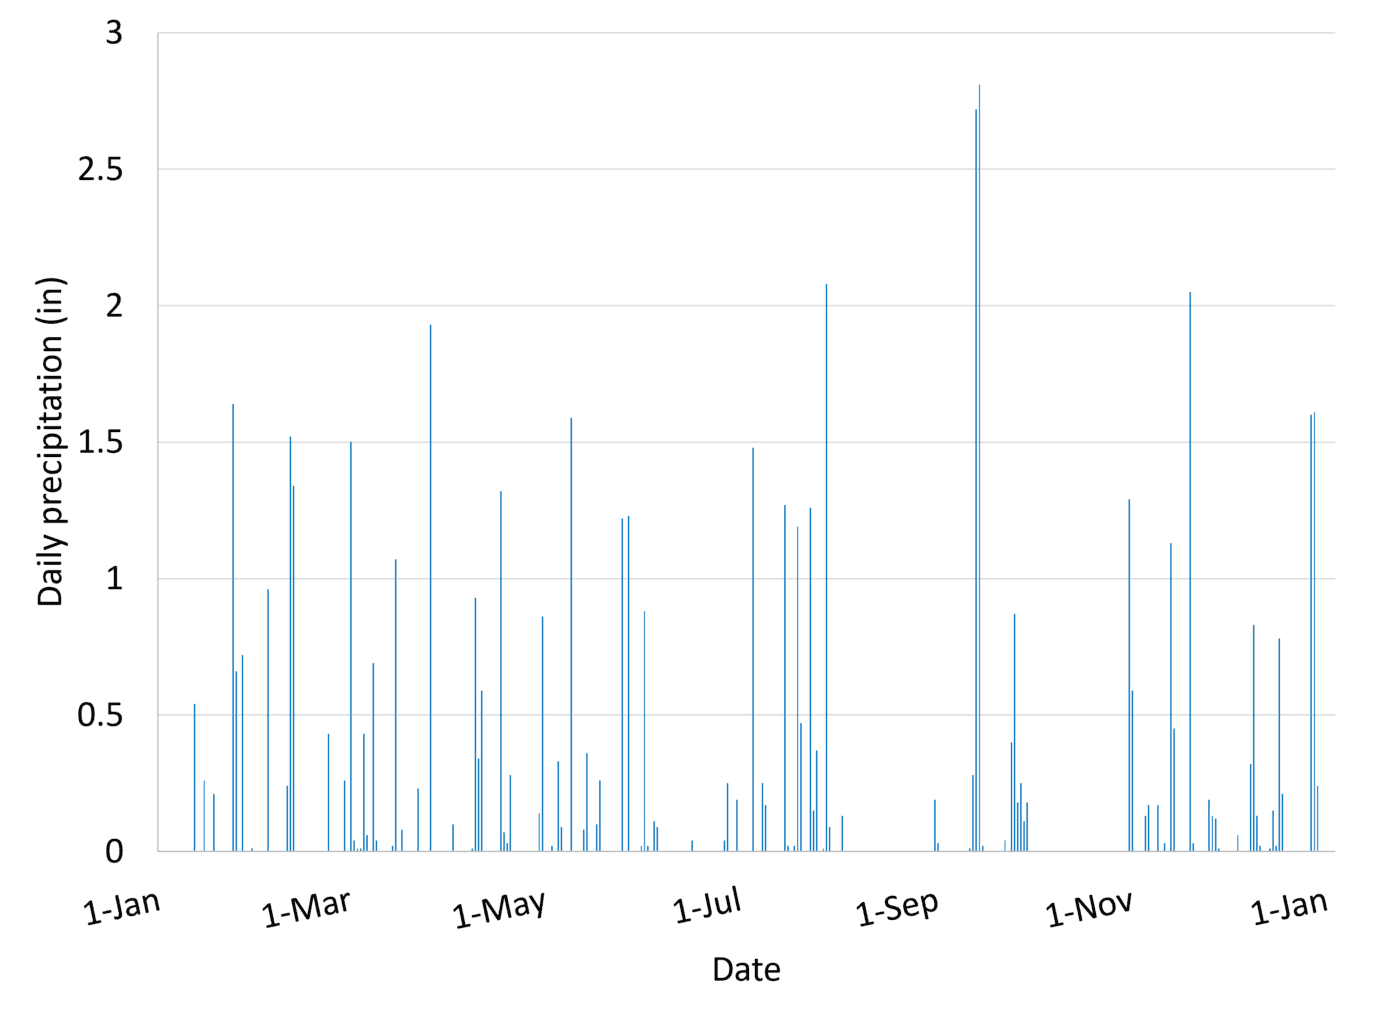
Figure 4. Daily precipitation data from a weather station near the farm between January 12, 2024, and January 3, 2025, provided by the NOAA National Climatic Data Center Daily Global Historical Climatology Network.
Results presented may differ from other farms depending on geographic location, water rates, and farm topography. This farm was well suited to incorporate the RWH system previously described because rainfall is consistent throughout the year in Cullman. It made economic sense to install a system because water rates were increasing, and the producer had land with beneficial topography to install such a system. Producers interested in using this technology should closely evaluate their specific situation and whether RWH makes economic sense.
To evaluate system performance, water use was monitored over a 12-month period covering six consecutive flocks on a commercial four-house broiler farm. Total water use during production was approximately 1.92 million gallons. Of that total, about 859,000 gallons (45 percent) came from municipal water, while approximately 1.06 million gallons (55 percent) came from harvested rainwater. Figure 4 illustrates the daily precipitation events that occurred during the 12-month monitoring period.
These results indicate that more than half of the farm’s annual water demand was supplied by rainfall. However, water use patterns varied throughout the year depending on environmental conditions and production demands. During cooler months, when evaporative cooling was not required (figure 5; flocks 1, 2, 5, and 6) and rainfall was more consistent, rainwater (RWU) supplied a large portion of total demand. In contrast, during summer flocks (flocks 3 and 4), water needs increased substantially due to evaporative cooling late in the flock, and periods of limited rainfall required greater reliance on municipal water (MWU). For instance, there was little to no rainfall in the last two weeks of flock 3.
Figure 5. Daily water use for a four-house farm across six consecutive flocks grown from January 12, 2024, to Jan. 3, 2025, separated into municipal water use (MWU; red) and rainwater use (RWU; green), shown in gallons.
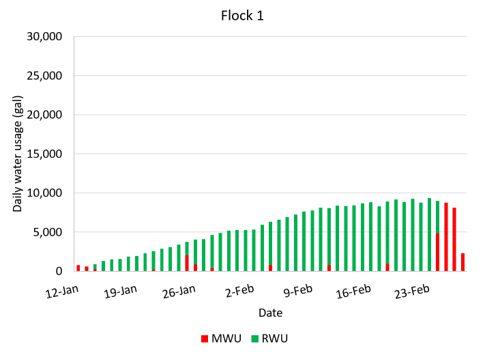
Figure 5A. Daily water use in gallons for flock 1 from approximately January 12 to February 28, 2024.
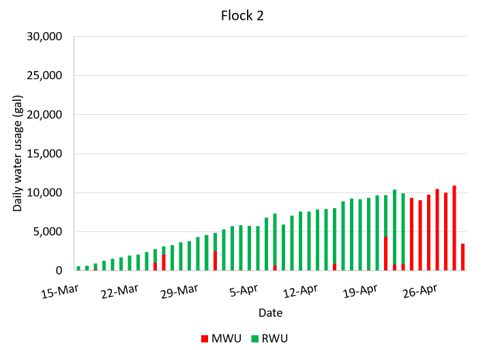
Figure 5B. Daily water use in gallons for flock 2 from approximately March 16 to April 30, 2024.
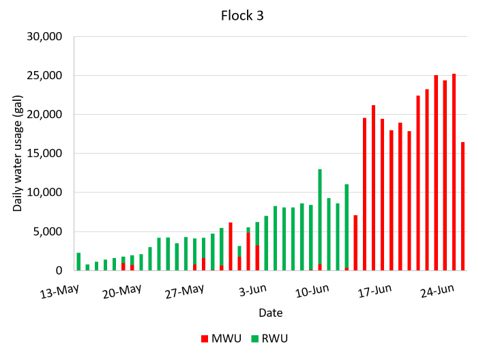
Figure 5C. Daily water use in gallons for flock 3 from approximately May 14 to June 26, 2024.
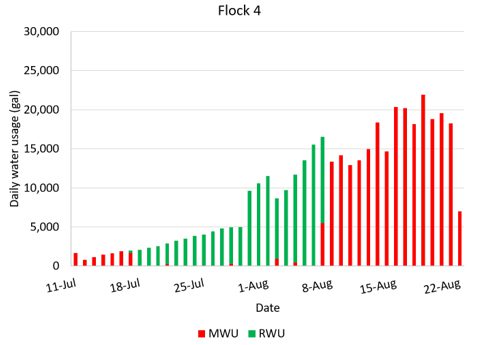
Figure 5D. Daily water use in gallons for flock 4 from approximately July 12 to August 24, 2024.
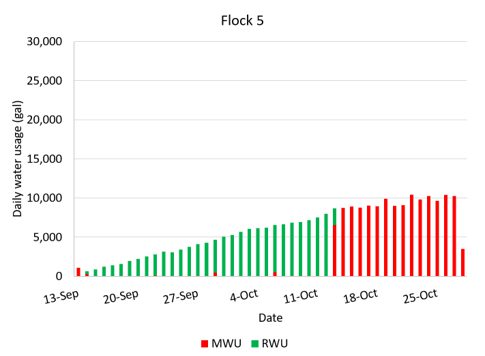
Figure 5E. Daily water use in gallons for flock 5 from approximately September 14 to October 29, 2024.
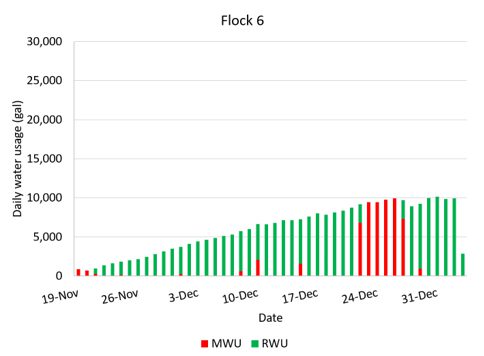
Figure 5F. Daily water use in gallons for flock 6 from approximately November 20, 2024, to January 5, 2025.
Economic savings from the system were also evaluated based on monthly Cullman city water rates ranging from $15.63 per 1,000 gallons (January to September) to $16.09 per 1,000 gallons (October to December), a 4 percent tax rate, and a $20 monthly infrastructure fee. Over the 12-month monitoring period, the estimated water bill without the rainwater harvesting system would have been approximately $31,000. With the system in place, the actual water bill during production was about $14,300, resulting in savings of approximately $17,000, or about 54 percent. The complete economic analysis is further detailed in the referenced scientific article under the For More Information section.
While these results demonstrate the potential for significant water bill savings in areas with higher water costs, the rainwater harvesting system’s performance depends on more than just installation. Proper design, operation, and maintenance are critical for long-term success. The system must be sized appropriately to handle expected rainfall and water demand, including peak periods during heavy rain events and high cooling demand. Components such as gutters, piping, storage, pumps, and filters must function reliably as part of an integrated system.
Producer feedback provided important insight into practical challenges associated with operating a rainwater harvesting system. Over time, components such as gutters, piping supports, and filters require maintenance or replacement. Issues such as sagging gutters, leaking joints, rusting components, and clogging from debris or pollen were observed. Expansion and contraction of piping also contributed to leaks and required design adjustments.
Economic feasibility is another important consideration. While the system evaluated in this study provided substantial cost savings, the benefits will vary depending on local conditions. Key factors include the cost of municipal water, the amount and distribution of rainfall, and the cost of installing and maintaining the system. In areas with low water costs, the return on investment may be limited even if the system performs well.
Overall, the results suggest that rainwater harvesting can be an effective tool for reducing water costs in high-cost regions and supplementing water supply in broiler production. However, success depends on careful evaluation of site conditions, proper system design, and consistent management.
Bottom line: Rainwater harvesting can provide significant water savings and reduce production costs, but it is not a standalone solution. Like any piece of equipment in a broiler house, it must be properly designed and installed, maintained, and managed as part of the overall farm system.
For More Information
Edge, C. M., Davis, J. D., Campbell, J. C., Simpson, E. H., & Purswell, J. L. (2026). Case study of a commercial broiler farm in the U.S. utilizing a rainwater harvesting system to offset water costs. Applied Engineering in Agriculture, 42(1), 147–157.
Funding Acknowledgment
Funding was provided in part by USDA project 58-6064-0-010, by the Alabama Agricultural Experiment Station, Auburn University, the Alabama Cooperative Extension System, and the Hatch program of the National Institute of Food and Agriculture, United States Department of Agriculture.

Jeremiah Davis, Professor, Biosystems Engineering, Director, National Poultry Technology Center; Carson Edge, Assistant Research Professor, Biosystems Engineering and National Poultry Technology Center; Cody Smith, Research Engineer, National Poultry Technology Center, all at Auburn University; and Joseph Purswell, Research Leader, USDA ARS Poultry Research Unit.
New September 2026, Rainwater Harvesting on Broiler Farms: Potential Water Savings, ANR-3291
For more information, contact your county Extension office. Visit aces.edu/directory.
Trade and brand names used in this publication are given for information purposes only. No guarantee, endorsement, or discrimination among comparable products is intended or implied by the Alabama Cooperative Extension System.