Farm Management
Average cropland and pastureland cash rental rates can be helpful to both agricultural producers and landowners in planning leasing arrangements or making production decisions.
Knowledge of farmland cash rental rates can be helpful in updating leasing arrangements and for budgeting production costs. Farmland cash rental rates were released by the US Department of Agriculture’s National Agricultural Statistics Service August 29, 2025. Rates are given for irrigated cropland, nonirrigated cropland, and pastureland for each county.
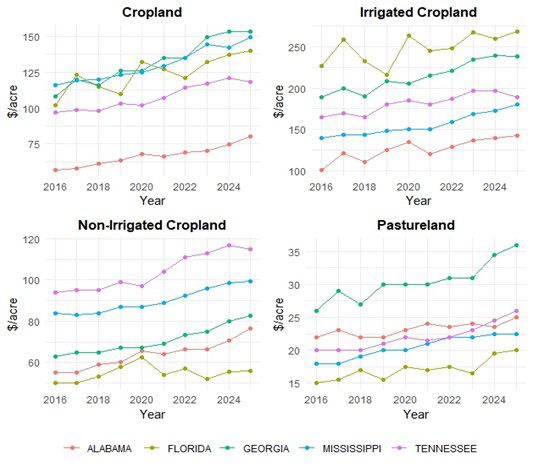
Figure 1. State-level farmland cash rent by year
Data Source: USDA-NASS
The following are some key highlights:
- Cash rental rates have slightly increased in Alabama since 2024.
- Cropland averaged $80.50 per acre, up $6 from 2024.
- Pastureland averaged $25 per acre, up $1.50 from 2024.
- Statewide, irrigated cropland averaged $142 per acre, while nonirrigated cropland averaged $76.50 per acre, both up from 2024.
- Cash rent varies significantly by county within Alabama, with the highest rates located in the following counties:
- Irrigated cropland: Houston County at $203 per acre
- Nonirrigated cropland: Limestone County at $127 per acre
- Pastureland: Autauga County at $50.50 per acre
Statewide Farmland Cash Rent
Nationally, the average cropland cash rental rate was recorded at $160 per acre and has steadily increased over the past few years, rising $20 in the last 6 years. Alabama and neighboring states remain below the national average but have risen steadily since 2019.
In Alabama, cropland averaged $80.50 per acre, up 8.05% from 2024; irrigated cropland averaged $142 per acre, an increase of $2 from 2024; and nonirrigated cropland received a rate of $76.50 per acre, up $6 from 2024. The rental rate for pastureland hit $25 per acre, up $1.50 from 2024. Over the past decade, both cropland and pastureland rental values have modestly increased in all states across the region (figure 1). Current cropland rates in Alabama fall behind neighboring states, with Georgia leading at $153 per acre. Similarly, Alabama falls behind Georgia and Tennessee for pastureland rates, with Georgia leading the region at $36 per acre.
Cash Rent by County
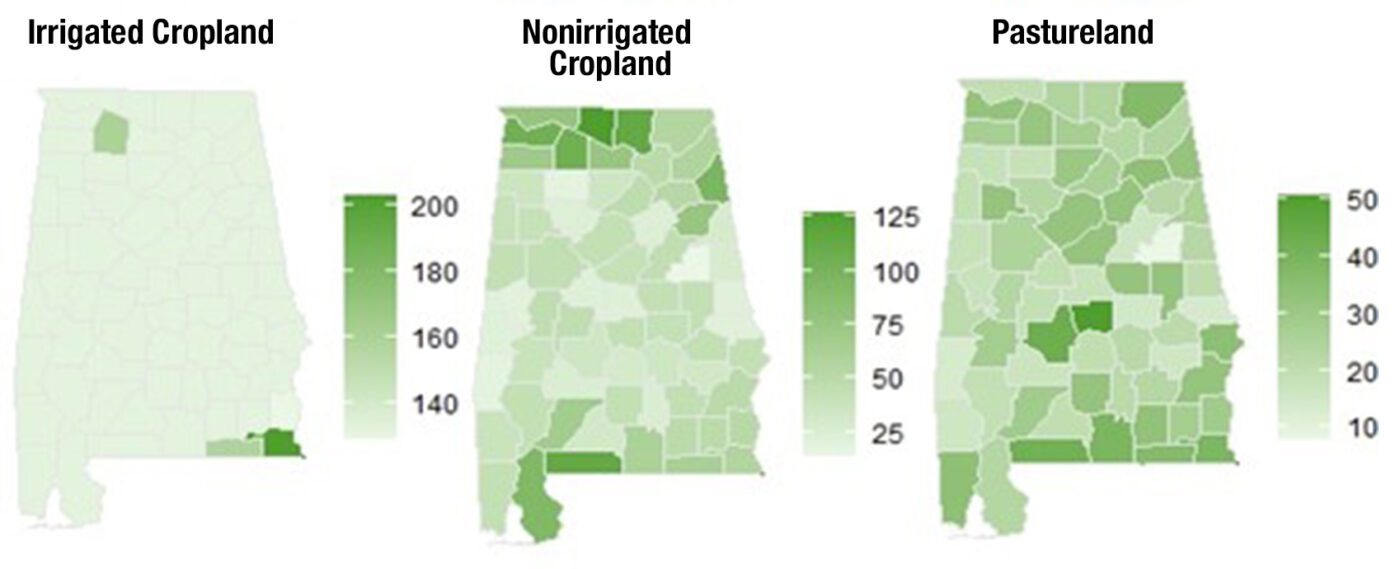
Figure 2. Alabama farmland cash rent by county, 2025 ($/acre)
Data Source: USDA-NASS
Rental rates vary greatly within the state. Figure 2 shows cash rent values by county (or group of counties) and type of cropland. The highest-value irrigated cropland was in Houston County at $203 per acre, while the lowest rate was in Henry County at $129 per acre. For nonirrigated cropland, Limestone County reached the highest rental rate at $127 per acre—a $15 increase from 2024. Madison, Escambia, Lawrence, and Colbert Counties also fall into this higher range with rates of more than $100 per acre. The lowest rate for nonirrigated cropland was at $13.50 per acre in Clay County. Autauga County had the highest rate for pastureland this year at $43.50 per acre, and Clay County had the lowest at $7.80 per acre.
Table 1 shows how cash rental values have changed from 2024, by county. Compared to 2024, cash rent for irrigated cropland decreased in all but 5 counties, while rental values for nonirrigated cropland increased in 36 of the state’s 67 counties. Results were mixed for pastureland, with 38 counties seeing increases in cash rent from 2024.
Some of these differences across the year are due to changes in methodology regarding the level at which cash rent was measured. For instance, in 2024, the rate for irrigated cropland in Houston County was calculated alongside other Wiregrass region counties in the multicounty average, but for 2025, Houston County was measured independently from counties included in the Wiregrass region multicounty average. While this gives a more precise 2025 calculation for Houston County, it reflects an increase over a less precise 2024 calculation. While the county-level values may provide a rough estimate of cash rent, they are often combined with other counties’ values (denoted with an asterisk in table 1). This is important to keep in mind when analyzing this information.
Table 1. Changes in Farmland Cash Rental Values by County from 2024 to 2025
| County | Region | Irrigated Cropland 2024 | Irrigated Cropland 2025 | Change | Nonirrigated Cropland 2024 | Nonirrigated Cropland 2025 | Change | Pastureland 2024 | Pastureland 2025 | Change |
|---|---|---|---|---|---|---|---|---|---|---|
| Autauga | Black Belt | 149* | 132* | -11.41% | 57.5 | 43.5* | -24.35% | 17.5 | 50.5 | 188.57 |
| Baldwin | Coastal Plains & Gulf Coast | 149* | 132* | -11.41% | 81 | 92.5 | 14.20% | 19.5 | 23.5 | 20.51 |
| Barbour | Wiregrass | 149* | 132* | -11.41% | 52 | 50.5 | -2.88% | 42 | 32* | 23.81% |
| Bibb | Upper Plains & Piedmont | 149* | 132* | -11.41% | 44* | 23 | -47.73% | 20* | 19.5 | -2.50% |
| Blount | Mountains & Eastern Valley | 149* | 132* | -11.41% | 38.5 | 47 | 22.08% | 21 | 26.5 | 26.19% |
| Bullock | Black Belt | 149* | 132* | -11.41% | 38 | 33 | -13.16% | 13.5 | 16 | 18.52% |
| Butler | Coastal Plains & Gulf Coast | 149* | 132* | -11.41% | 33 | 43.5* | 31.82% | 25 | 32* | 28.00% |
| Calhoun | Mountains & Eastern Valley | 149* | 132* | -11.41% | 77.5 | 76 | -1.94% | 20 | 22.5 | 12.50% |
| Chambers | Upper Plains & Piedmont | 149* | 132* | -11.41% | 26 | 20.5 | -21.15% | 16.5 | 20.5 | 24.24% |
| Cherokee | Mountains & Eastern Valley | 149* | 132* | -11.41% | 97 | 96 | -1.03% | 26.5 | 32* | 20.75% |
| Chilton | Upper Plains & Piedmont | 149* | 132* | -11.41% | 21.5 | 22.5 | 4.65% | 28.5 | 17.5 | -38.60% |
| Choctaw | Coastal Plains & Gulf Coast | 149* | 132* | -11.41% | 18 | 18 | 0.00% | 20* | 13.5 | -32.50% |
| Clarke | Coastal Plains & Gulf Coast | 149* | 132* | -11.41% | 13 | 43.5* | 324.62% | 28.5 | 19 | -33.33% |
| Clay | Upper Plains & Piedmont | 149* | 132* | -11.41% | 13.5 | 13.5 | 0.00% | 6.3 | 7.8 | 23.81% |
| Cleburne | Mountains & Eastern Valley | 149* | 132* | -11.41% | 32 | 29 | -9.38% | 22 | 26 | 18.18% |
| Coffee | Wiregrass | 149* | 132* | -11.41% | 40.5 | 49 | 20.99% | 48 | 33 | -31.25% |
| Colbert | Northern Valley | 149* | 132* | -11.41% | 122 | 104 | -14.75% | 16.5 | 32.5 | 96.97% |
| Conecuh | Coastal Plains & Gulf Coast | 149* | 132* | -11.41% | 16.5 | 32 | 93.94% | 20* | 20 | 0.00% |
| Coosa | Upper Plains & Piedmont | 149* | 132* | -11.41% | 44* | 43.5* | -1.14% | 20* | 32* | 60.00% |
| Covington | Wiregrass | 149* | 132* | -11.41% | 54.5 | 60.5 | 11.01% | 42.5 | 39 | -8.24% |
| Crenshaw | Wiregrass | 149* | 132* | -11.41% | 19.5 | 26 | 33.33% | 25.5 | 21.5 | -15.69% |
| Cullman | Mountains & Eastern Valley | 149* | 132* | -11.41% | 42.5 | 35.5 | -16.47% | 25 | 30.5 | 22.00% |
| Dale | Wiregrass | 72 | 132* | 83.33% | 47.5 | 49 | 3.16% | 28 | 28 | 0.00% |
| Dallas | Black Belt | 149* | 132* | -11.41% | 38.5 | 34.5 | -10.39% | 23.5 | 43 | 82.98% |
| DeKalb | Mountains & Eastern Valley | 149* | 132* | -11.41% | 53 | 57.5 | 8.49% | 32.5 | 24 | -26.15% |
| Elmore | Black Belt | 149* | 132* | -11.41% | 36 | 42.5 | 18.06% | 15 | 15 | 0.00% |
| Escambia | Coastal Plains & Gulf Coast | 149* | 132* | -11.41% | 94.5 | 113 | 19.58% | 38.5 | 41.5 | 7.79% |
| Etowah | Mountains & Eastern Valley | 149* | 132* | -11.41% | 54 | 52.5 | -2.78% | 21.5 | 34 | 58.14% |
| Fayette | Upper Plains & Piedmont | 149* | 132* | -11.41% | 35.5 | 41.5 | 16.90% | 20.5 | 32* | 56.10% |
| Franklin | Northern Valley | 149* | 132* | -11.41% | 86.5 | 71 | -17.92% | 17 | 27 | 58.82% |
| Geneva | Wiregrass | 131 | 158 | 20.61% | 59 | 63 | 6.78% | 29.5 | 36.5 | 23.73% |
| Greene | Black Belt | 149* | 132* | -11.41% | 23 | 20 | -13.04% | 13.5 | 17.5 | 29.63% |
| Hale | Black Belt | 149* | 132* | -11.41% | 44* | 45 | 2.27% | 33 | 23.5 | -28.79% |
| Henry | Wiregrass | 149* | 129 | -13.42% | 51 | 52 | 1.96% | 40.5 | 29 | -28.40% |
| Houston | Wiregrass | 149* | 203 | 36.24% | 63.5 | 56.5 | -11.02% | 26 | 38.5 | 48.08% |
| Jackson | Mountains & Eastern Valley | 149* | 132* | -11.41% | 46 | 55.5 | 20.65% | 30.5 | 37 | 21.31% |
| Jefferson | Upper Plains & Piedmont | 149* | 132* | -11.41% | 44* | 43.5* | -1.14% | 20* | 32* | 60.00% |
| Lamar | Upper Plains & Piedmont | 149* | 132* | -11.41% | 38 | 40.5 | 6.58% | 20 | 19 | -5.00% |
| Lauderdale | Northern Valley | 149* | 132* | -11.41% | 81 | 77 | -4.94% | 20 | 20 | 0.00% |
| Lawrence | Northern Valley | 155 | 160 | 3.23% | 113 | 105 | -7.08% | 43.5 | 31.5 | -27.59% |
| Lee | Upper Plains & Piedmont | 149* | 132* | -11.41% | 27.5 | 20.5 | -25.45% | 20.5 | 14 | -31.71% |
| Limestone | Northern Valley | 149* | 132* | -11.41% | 112 | 127 | 13.39% | 21 | 24.5 | 16.67% |
| Lowndes | Black Belt | 149* | 132* | -11.41% | 44* | 30.5 | -30.68% | 24.5 | 20 | -18.37% |
| Macon | Black Belt | 149* | 132* | -11.41% | 43 | 43.5* | 1.16% | 19 | 21 | 10.53% |
| Madison | Northern Valley | 131 | 132* | 0.76% | 101 | 113 | 11.88% | 25 | 24 | -4.00% |
| Marengo | Black Belt | 149* | 132* | -11.41% | 40.5 | 39 | -3.70% | 31 | 28 | -9.68% |
| Marion | Northern Valley | 149* | 132* | -11.41% | 40 | 37 | -7.50% | 17 | 18.5 | 8.82% |
| Marshall | Mountains & Eastern Valley | 149* | 132* | -11.41% | 34.5 | 50 | 44.93% | 20* | 23 | 15.00% |
| Mobile | Coastal Plains & Gulf Coast | 149* | 132* | -11.41% | 63.5 | 43.5* | -31.50% | 41.5 | 34 | -18.07% |
| Monroe | Coastal Plains & Gulf Coast | 149* | 132* | -11.41% | 63 | 67.5 | 7.14% | 20* | 28.5 | 42.50% |
| Montgomery | Black Belt | 149* | 132* | -11.41% | 47.5 | 34.5 | -27.37% | 17.5 | 22 | 25.71% |
| Morgan | Northern Valley | 149* | 132* | -11.41% | 59.5 | 76.5 | 28.57% | 18 | 27.5 | 52.78% |
| Perry | Black Belt | 149* | 132* | -11.41% | 53 | 45.5 | -14.15% | 19 | 19 | 0.00% |
| Pickens | Upper Plains & Piedmont | 149* | 132* | -11.41% | 17 | 43.5* | 155.88% | 18 | 18 | 0.00% |
| Pike | Wiregrass | 149* | 132* | -11.41% | 34.5 | 44 | 27.54% | 23.5 | 23 | -2.13% |
| Randolph | Upper Plains & Piedmont | 149* | 132* | -11.41% | 26.5 | 28 | 5.66% | 22 | 22.5 | 2.27% |
| Russell | Wiregrass | 149* | 132* | -11.41% | 24 | 43.5* | 81.25% | 18.5 | 34.5 | 86.49% |
| St. Clair | Mountains & Eastern Valley | 149* | 132* | -11.41% | 19 | 24.5 | 28.95% | 20* | 32* | 60.00% |
| Shelby | Upper Plains & Piedmont | 149* | 132* | -11.41% | 35.5 | 42 | 18.31% | 20* | 32 | 60.00% |
| Sumter | Black Belt | 149* | 132* | -11.41% | 23 | 21 | -8.70% | 18.5 | 21 | 13.51% |
| Talladega | Upper Plains & Piedmont | 105 | 132* | 25.71% | 35.5 | 45.5 | 28.17% | 23 | 16 | -30.43% |
| Tallapoosa | Upper Plains & Piedmont | 149* | 132* | -11.41% | 21 | 43.5 | 107.14% | 12 | 32* | 166.67% |
| Tuscaloosa | Upper Plains & Piedmont | 149* | 132* | -11.41% | 39.5 | 44 | 11.39% | 21.5 | 25 | 16.28% |
| Walker | Upper Plains & Piedmont | 149* | 132* | -11.41% | 19 | 23.5 | 23.68% | 20* | 23 | 15.00% |
| Washington | Coastal Plains & Gulf Coast | 149* | 132* | -11.41% | 26.5 | 38.5 | 45.28% | 22 | 16 | -27.27% |
| Wilcox | Coastal Plains & Gulf Coast | 149* | 132* | -11.41% | 20.5 | 26.5 | 29.27% | 18 | 17 | -5.56% |
| Winston | Northern Valley | 149* | 132* | -11.41% | 44* | 18.5 | -57.95% | 18 | 18 | 0.00% |
Farmland Values
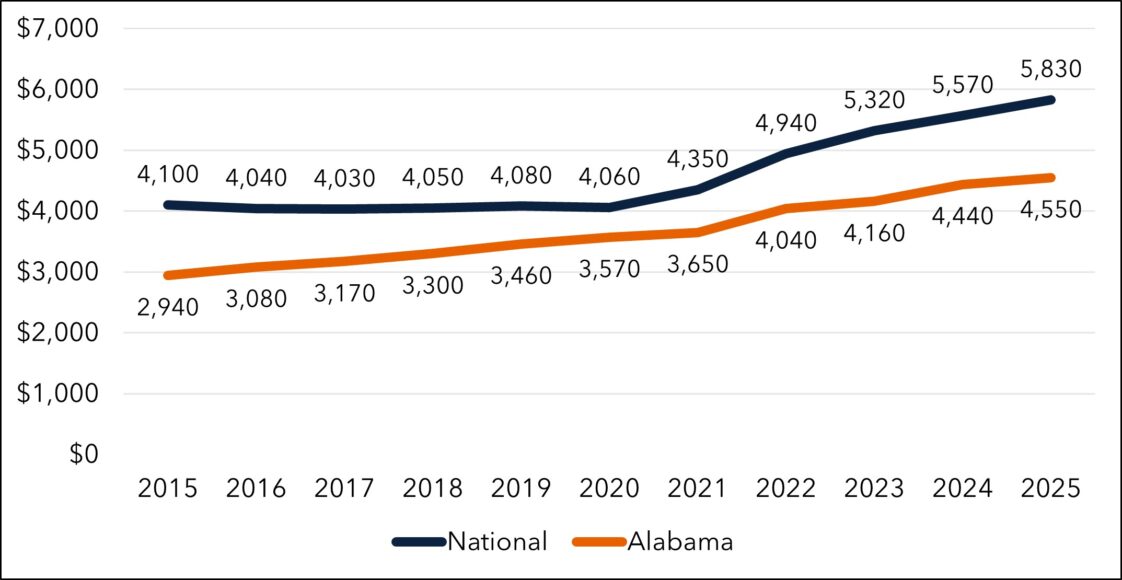
Figure 3. US and Alabama farmland values, 2015–2025
Data Source: USDA-NASS
Farmland-value data can be helpful for management decisions and is typically tied to the cash rental rate. For 2025, the national average value of farmland (cropland and pastureland) was recorded at $5,830 per acre. Specifically for Alabama, farmland averaged $4,550 per acre, representing a $980 increase over the past 5 years. Nationally, in the last year, land values have risen by 4.67%, outpacing the 2.4% inflation rate observed during that time. It is also important to recognize that while Alabama’s average farmland rate is $4,550 per acre, this value may differ tremendously throughout the state.
Conclusion
Average cropland and pastureland cash rental rates can be helpful to both agricultural producers and landowners when planning to arrange leases or analyzing production decisions. However, when using this information, keep in mind that attributes of plots of land differ within a county, and the values presented in this publication are averages. Careful thought should be given to any decisions regarding the rental value of land.
 Wendiam Sawadgo, Extension Economist, Assistant Professor, and and Maire Scott, Undergraduate Student Worker, both in Agricultural Economics and Rural Sociology, Auburn University
Revised January 2026, 2025 Alabama Farmland Cash Rental Rates, ANR-2745