Crop Production

As more center pivot irrigation systems are used in the southeast, farmers and consultants must be able to identify their most common maintenance and operation problems to avoid crop yield losses, increased energy costs, and get full operational performance and economic return.
Introduction
Failure to properly operate and maintain irrigation systems causes problems that can lead to improper water application, which can cause crop yield losses, increased energy use, plant diseases, and even nitrogen losses due to leaching or surface runoff. As more center pivot irrigation systems are used in the southeast, farmers and consultants must be able to identify the most common problems.
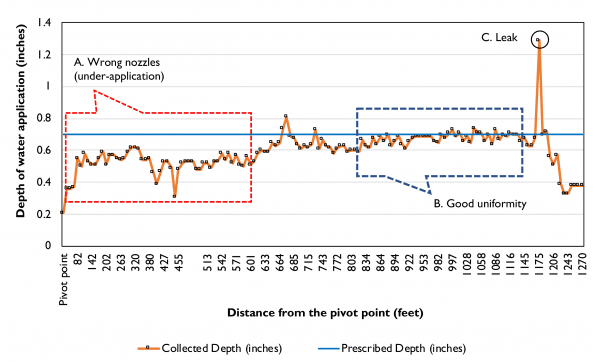
Figure 1. Common problems with uniformity of water application identified using a catch-can test.
Each center pivot irrigation system rotates around a pivot point, most commonly located in the center of a field. The system consists of an assembled series of lateral pipes of varying lengths (90 to 250 feet) that are supported by ground structures called towers, each of which has two wheels. The pivot sections between each tower are called spans, and most pivots have five to seven spans. Electric or hydraulic motors at each tower power the two wheels. Sprinklers installed along the main lateral pipeline deliver water to crops as the system traverses the pivot area of coverage. The sprinkler heads and nozzles vary in type, size, and spacing along the pipeline to meet the discharge requirement and capacity of the pivot system. The height and spacing of the sprinklers are key to maximizing the uniformity of application and minimizing runoff, evaporation, and drift.
A pump lifts the water from a well, pond, or other water source and creates the design pressure and flow rate required to deliver water to the pivot point and through the sprinklers along the pipeline.
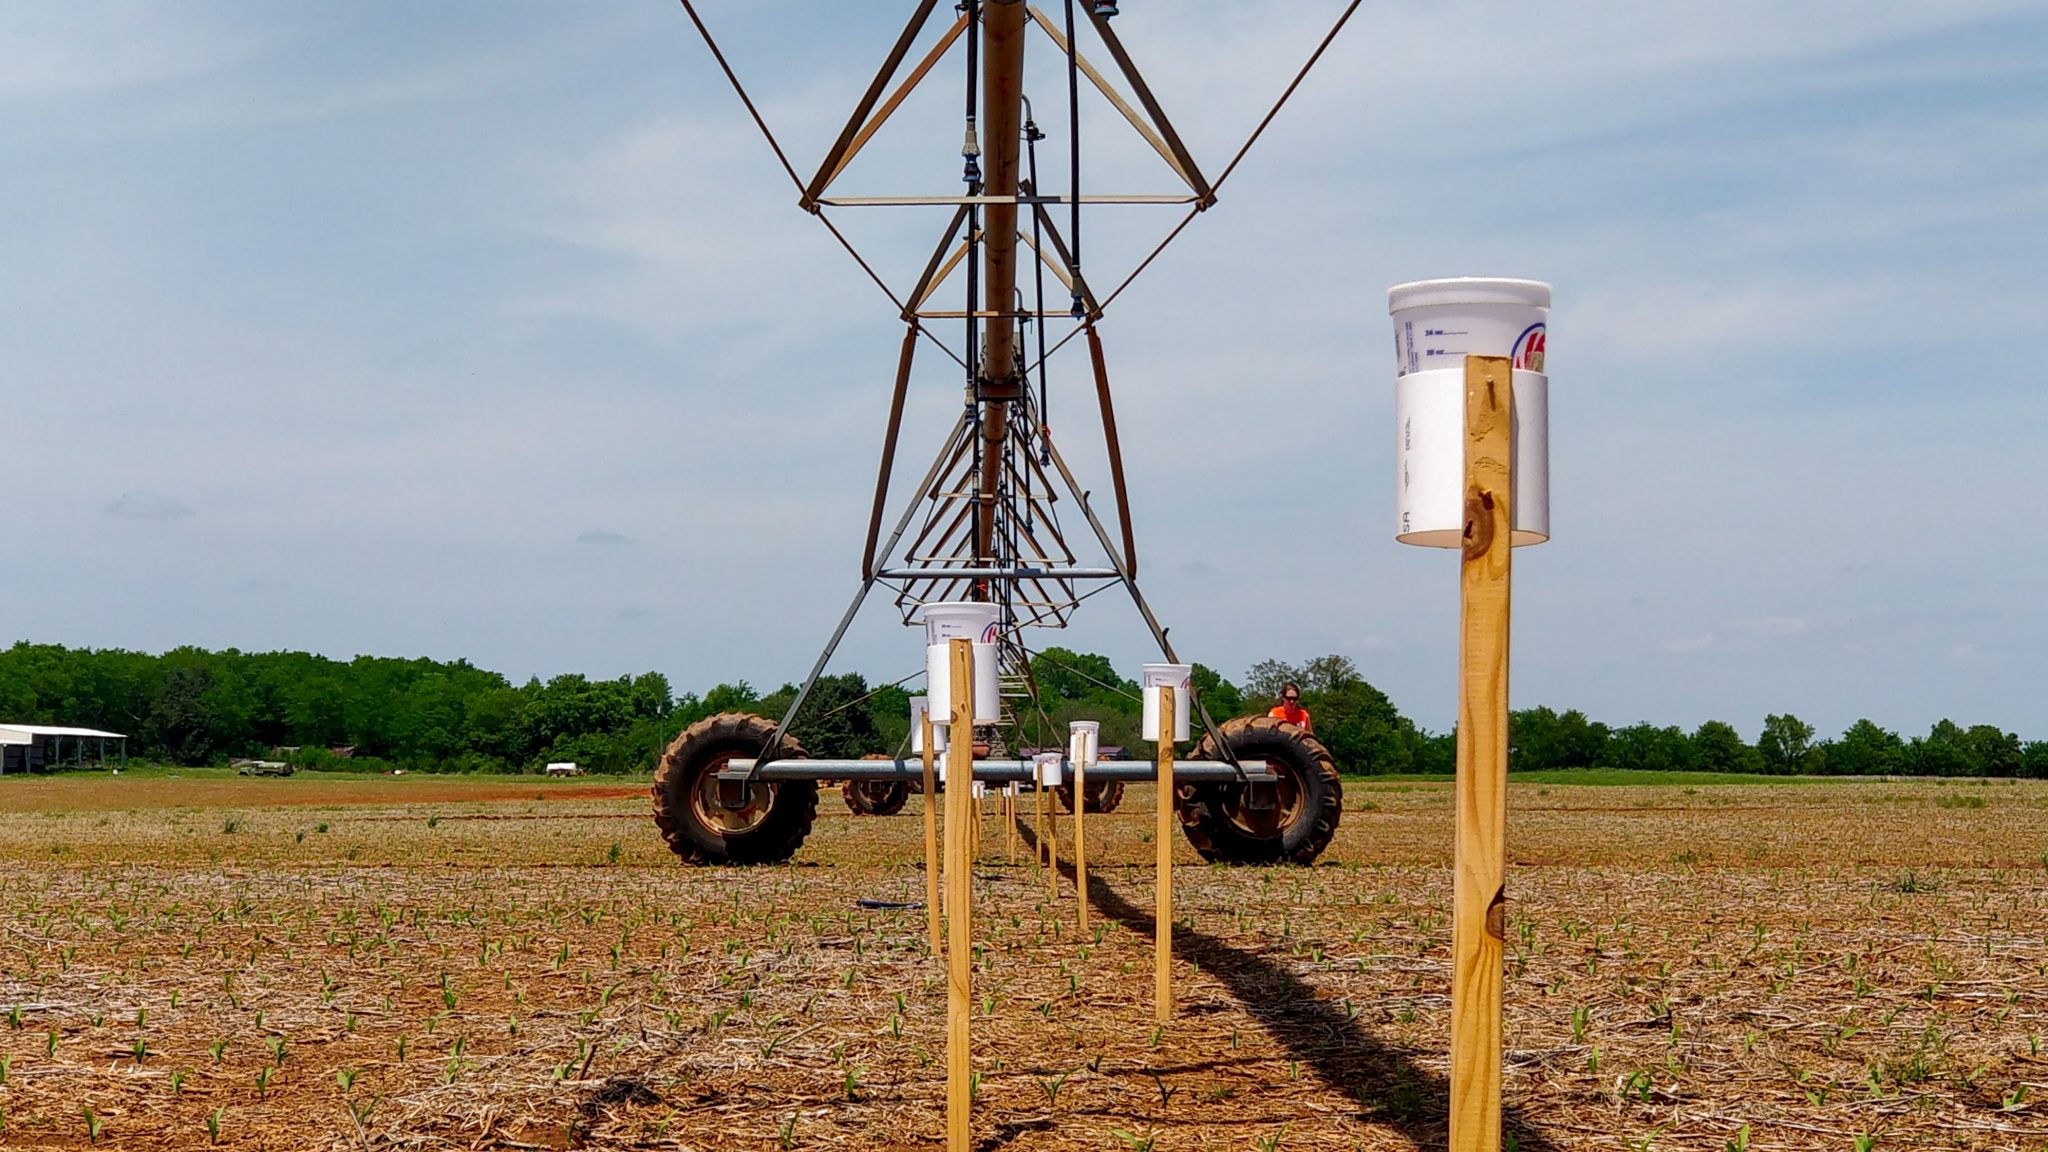
The common causes of poor uniformity in water application of pivot irrigation systems are related to inadequate pump operating pressure and/or flow rate, incorrect nozzle size and placement (figure 1[A]), worn or clogged nozzles, missing sprinkler heads, and leaking boots (flexible unions between span pipes) (figure 1[C]), and incorrect control panel settings. These issues not only reduce the efficiency of water application but also increase the risk for yield losses and increase water pumping time, thus increasing energy use, leading to higher irrigation costs. Before starting a new irrigation season, have a field evaluation of the irrigation system or use a catch-can test to assess the uniformity of water application and to identify problems (figure 2).
Following are frequently observed problems related to the operation and maintenance of center pivot irrigation systems.
Operating Pressure
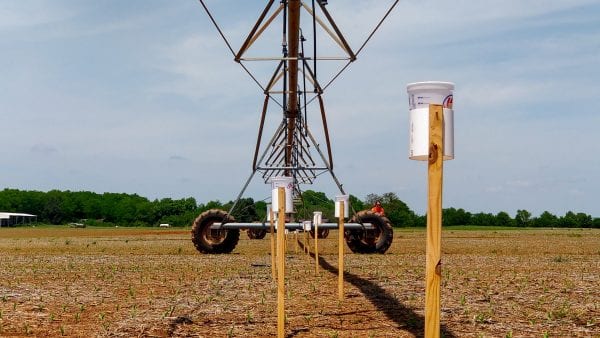
Figure 2. Uniformity of water application on a center pivot irrigation system assessed using a catch-can test.
The operating pressure of the center pivot irrigation system affects water application uniformity, and the operating pressure and size and shape of the sprinkler nozzles affect the water flow rate along the pivot pipeline. Typically, sprinkler packages are designed specifically for a center pivot irrigation system operating at the design pressure and flow rate (figure 2). Operating a system at a pressure higher or lower than the design pressure affects the water droplet size and distribution, and, in the case of rotating spray sprinklers, it could affect the sprinkler rotation time. Insufficient pressure increases the droplet size, decreases the velocity of water as it exits the nozzles, and decreases the water flow along the pipeline. This reduces the amount of water reaching the far end of the pivot. Excessive pressure may cause small droplets, which are prone to evaporation and wind drift. Both insufficient and excessive pressure may increase energy costs due to the overapplication of water. The most common causes of operating pressure difficulties are as follows:
- Wells in which groundwater declines through the growing season
- Worn pump impellers
- Water leakage from sprinklers along the irrigation system
- Elevation of the terrain
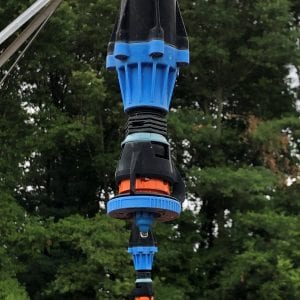
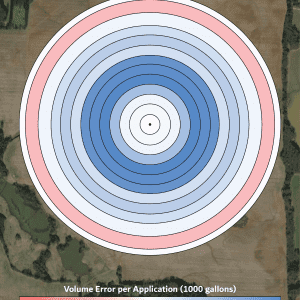
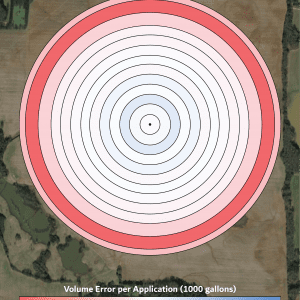
The impact of operating a 2,036-foot center pivot irrigation system below the designed pressure was studied in 2020. In the study, surface water was pumped from a creek into an irrigation pond and from the pond to the pivot. The pivot had 12 spans plus the overhang and 219 sprinklers equipped with low-pressure spray heads, rotating deflection pads, and 15-pound per-square-inch (psi) pressure regulators (figure 3). According to the sprinkler chart, the system was originally designed to pump water at a pressure of 80 psi and a flow rate of 1,500 gallons per minute (GPM). However, the farmer was only able to pump water at 50 psi; therefore, an analysis was conducted to determine how reduced psi affected water application. Reducing the operating pressure from 80 to 50 psi caused overapplication of water, 18 percent on average, throughout the entire system but especially on spans 4 to 7 (53 percent average overapplication). The dark blue rings in figure 4 show where the overapplication occurred. Since the sprinkler chart showed the system was originally designed for a pumping pressure of 80 psi, it was determined that the nozzle sizes were too large when the pump was operated at 50 psi. For example, the original sprinkler chart for an 80-psi pump recommended a 30-32 nozzle size for sprinklers 42 to 50 (span 5). However, if the pivot is operated at 50 psi, 25-26 nozzle size should be used for the same sprinklers. To prevent this specific problem, irrigation operators should frequently check the pump pressure (manually or automatically) and monitor water source levels (well or pond) to identify potential impacts to pumping pressure.
Click on the images below to see them at full scale.
- Figure 3. Sprinklers with rotator nozzles and pressure regulators.
- Figure 4. Overapplication of water, especially on spans 4 to 7 out of 12 due to reduced pump pressure.
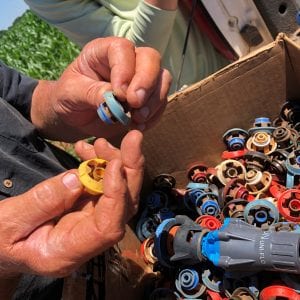
- Figure 5. Most sprinkler companies use different colors to differentiate the nozzle sizes.
Incorrect or Out of Sequence Nozzles
Problems with water application uniformity can be also caused by using the incorrect nozzle size or type, using a nozzle size out of sequence with respect to the original sprinkler chart, and/or using worn or clogged nozzles. Nozzles are designed with specific sizes of the nozzle opening on the sprinkler to deliver a precise amount of water according to a certain operation pressure range. Application efficiency decreases if the nozzle manufacturer specifications are not followed. For example, different sprinkler types operate at specific pressure ranges. Rotators operate within a range of 10 to 50 psi, and spinners operate within a range of 10 to 20 psi.
The color of the nozzles corresponds to different nozzle sizes, and the shape and color of the spray plate indicate a specific width of throw (figure 5). Nozzle size and plate shape are designed for specific pressures; therefore, when replacing a missing or worn sprinkler, it is important to check the sprinkler chart to select the right nozzle size and type according to the specific sprinkler number on the pivot. A uniformity of water application test was conducted in 2020 to evaluate how nozzle size or catch can test affects the uniformity of application. The same 2,036-foot center pivot irrigation system was used for this test. Because the farmer could only operate the pump at 50 psi, a redesign of the sprinkler chart was necessary; however, over the years, nozzles along the pivot pipeline were not always replaced with those matching the sprinkler chart.
The uniformity of the water application test indicated significant under-application of water on the outer spans of the pivot (figure 6). The pivot was set to apply a uniform rate of 0.6 acre-inches, and the test results showed under-application of 6 percent, 20 percent, and 14 percent on spans 11, 12, and the overhang, respectively (figure 6).
The cause of under-application on spans 11 and 12 and the overhang was associated with smaller nozzles than indicated by the sprinkler chart. The reason for the under-application is simple: smaller nozzle openings, also called orifices, restrict the flow of water, leading to decreased water application. It is important to remember that the outer spans travel much farther per revolution of the pivot and therefore cover substantially more area than the inner spans, so application errors (either under- or overapplication) in outer spans may have disproportionately large negative impacts on yield compared to inner spans. In the case of the pivot in this example, spans 11, 12, and the overhang covered 127 acres corresponding to 38 percent of the total irrigated area (329 acres) by this pivot.
Click on the images below to see them at full scale.
- Figure 6. Wrong-size nozzles can cause over- or under-application of irrigation water.
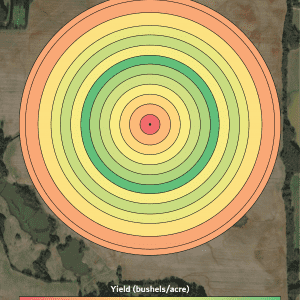
- Figure 7. Yield differences by span mostly associated with pivot maintenance problems.
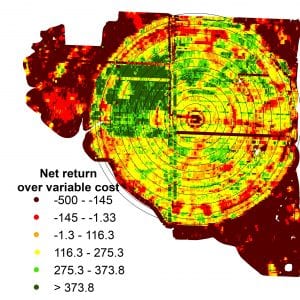
- Figure 8. Spatial analysis of net returns across irrigated and dryland areas shows the economic impact of irrigation and pivot maintenance.
Farmers and consultants should always refer to the sprinkler chart when replacing nozzles or spray plates on the pivot. Avoid replacing broken nozzles with nozzles from other sections of the pivot or from other pivots.
Using yield maps or remote sensing images (satellite, airplane, or drones) during the growing season helps identify spans where water may be underapplied. In the case of the pivot in the previous examples, a possible under-application of water was identified on span 12 and the overhang using the 2012 corn yield map (2012 was a dry season). The low yield under span 12 followed the circular band shape and, across that span, there was a 12 percent yield reduction with respect to the field average yield under the pivot (figures 7 and 8). A net return map was generated for 2012, and two conclusions were made: one, that proper pivot maintenance reduces the risk of yield losses and increases the possibilities of return on investment.
As shown in figures 7 and 8, the lowest yield and net returns were estimated for the whole field but specifically for span 12 and the overhang. Net returns for span 12 and the overhand were approximately 47 percent lower compared to the average net returns of the irrigated area.
And, as expected, failure to properly maintain the pivot has a higher economic impact in dry years than in wet years. The producer incurs the investment cost in the irrigation system regardless of yield, and when irrigation systems are under- or overapplying water, there is an economic consequence due to the amount of water applied, resulting in lower yields or yields that do not reflect the amount of water applied.
Dryland areas surrounding an irrigated field are also a clear indicator of the benefit of irrigation—where irrigated yields are similar to dryland yields, there is potentially a problem with the irrigation system. As shown in figure 8, assuming the dryland corners were managed with the same production practices as the irrigated area, the farmer incurred negative net returns on average. There were small areas of positive net returns above variable costs in the dryland corners; however, these areas were a minor portion of the dryland area. The net returns depend on the corn price and production costs, which do differ by producer. Growers should keep records of production costs associated with the dryland areas of irrigated fields as it may be financially beneficial to leave those areas fallow or enroll them in a conservation program.
Irrigation Control Panel Settings
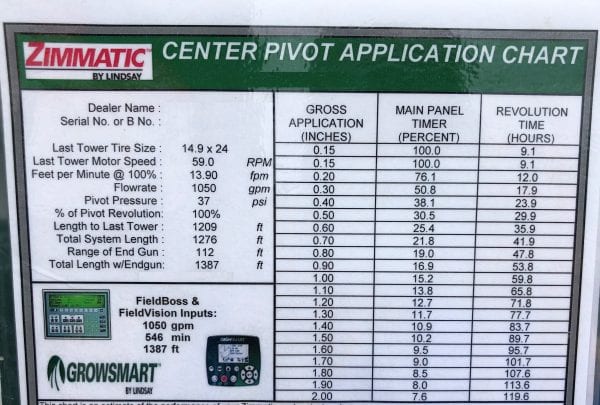
Figure 9. Example of a center pivot water application chart.
The travel speed of the pivot determines the amount of water applied (acre-inches) according to the specific irrigation system design. The faster the pivot travels, the less water is applied. For every pivot, there is a water application chart that indicates the amount of water applied according to specific travel speed settings, often stored or displayed at the control panel (figure 9). If the irrigation operator selects the 100 percent option on the control panel, the end tower moves continuously. If the 50 percent option is selected, the end tower moves 30 seconds and stops 30 seconds each minute, except for in T-L hydraulic irrigation systems. The time required to complete a revolution of the pivot depends on the settings selected on the panel, in this case, the percent timer to apply a specific irrigation amount, and also the pivot design flow rate, the pivot length, and the motor on the last tower. Although modern control panels now automatically set the main panel timer to apply a specific amount, knowing how long the pivot takes to complete the application of a predefined irrigation rate is necessary and important. If the pivot water application chart is missing, contact the irrigation dealer to obtain a copy.
If the irrigation operator selects the incorrect settings on the control panel or the panel is not working properly, the pivot may travel over a crop field applying an inaccurate amount of water. In 2019, one study found that a pivot was applying the incorrect rate after data collected by soil sensors installed in a cotton field was analyzed. On July 9, the farmer set the pivot to apply 0.8 acre- inches of water, and, according to the application chart of that specific pivot, the pivot should have taken 56 hours to cover the field. Instead, the pivot took 14 hours to complete the cycle. These discrepancies were the result of a machine error not detected by the farmer. An irrigation event of 0.8 acre-inches should decrease soil water tension (SWT) and increase soil moisture at least in the top 6 inches of soil; however, no changes in SWT were registered that day (figure 10). On July 30, a rainfall event of 0.5 inches resulted in a decrease in SWT in the top 6 inches of soil (figure 10). Even though the changes in soil water at various depths resulting from rain or irrigation were not the same, irrigation of 0.8 acre-inches should change soil water to a degree similar to a rainfall event of 0.5 inches. On August 5, the farmer set the pivot to apply 0.8 acre-inches, and as on the earlier date, the pivot completed the cycle in 14 hours instead of the predicted 56 hours. As a result, approximately 0.2 acre- inches of irrigation water were applied. The soil sensor recorded no significant changes in SWT on August 5 or 6 because of this irrigation event (figure 10). This example shows how data from soil moisture sensors can also help farmers assess problems with irrigation water application.
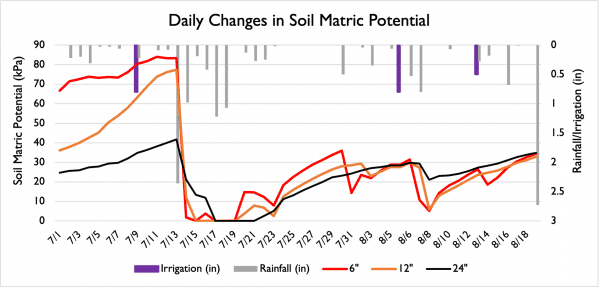
Figure 10. Daily changes in soil matric potential as a result of rainfall or irrigation.
Farmers and consultants should carefully review pivot application charts and monitor pivot operations, paying attention to any deviations in the pivot revolution time with respect to specific irrigation amounts. Applying incorrect amounts of irrigation increases the risk for yield losses and higher irrigation costs.
Final Recommendations
- Before the irrigation season starts, check for clogged or worn nozzles, missing sprinkler heads, and/or leaking boots.
- Do not replace nozzles without referring to the pivot sprinkler chart. Verify the nozzle size is correct for the pivot location to ensure the nozzle operates at the specified pressure along the pivot.
- If you operate a variable rate irrigation (VRI) system, check if the solenoid valves are operating properly and electronics have not been damaged during fall or winter months.
- A catch-can test is recommended every year to evaluate the uniformity of water application.
- Make sure the pivot operates at the pressure for the designated sprinkler chart.
- Be aware that the revolution time, or speed, of the pivot is directly related to the amount of irrigation water to be applied.
References
Leib, B.G., T. Grant. 2019. Understanding Center Pivot Application Rate. W809-F Extension Fact Sheet. University of Tennessee.
Martin, D., W. Kranz, T. Smith, S. Irmak, C. Burr, R. Yoder. 2017. Center Pivot Irrigation Handbook. EC3017 Extension Publication. Nebraska Extension.
New, L., G. Fipps. 2015. Center Pivot Irrigation. B-6096 Extension Publication. Texas Agricultural Extension Service. The Texas A&M University System.
Kranz, W., D. Yonts, D. Martin. 2005. Operating characteristics of Center Pivot Sprinklers. G1532 Extension Publication. Nebraska Extension.
Download a PDF of Operation & Maintenance Problems of Center Pivot Irrigation, ANR-2772.


