Crop Production
Learn about crop evapotranspiration for irrigation scheduling and the implementation tools currently available for farmers and consultants.
Irrigation Scheduling
Determining the right irrigation amount at the right time is not always easy. Soil type, soil water–holding capacity, plant growth stage, and weather conditions are a few factors influencing irrigation decisions. Currently, the most common support tools for irrigation scheduling decisions available to producers in the Southeast are soil sensor–based, crop evapotranspiration–based, and plant–based. Soil sensors are effective in determining changes in soil water content or water level. Still, they require installation, maintenance, and removal as well as the identification of the sensor location that best represents the field average conditions, which takes time and labor. Crop evapotranspiration-based methods use a water balance approach to calculate the water amount lost by a cropped surface to recommend irrigation amount and timing, with the drawback of using a predefined crop coefficient based on the growth stage. Plant-based irrigation scheduling methods, such as pressure chamber, the sap flow, and infrared canopy temperature, use plant water status as an irrigation triggering point, but they are expensive, require specialized equipment and knowledge, and are usually explored more by the scientific community. Among these methods, this publication describes the crop evapotranspiration-based method and tools that facilitate its implementation.
Crop Evapotranspiration
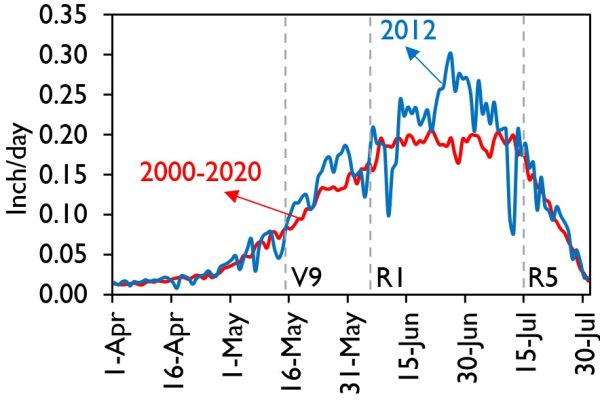
Figure 1. Historical average of daily corn crop evapotranspiration (ETc) considering 21 years of weather records (red line) and ETc during the 2012 growing season (blue line) for a location in the northwest region of Alabama.
Crop evapotranspiration (ETc) is an essential factor in irrigation scheduling. Water goes from liquid to vapor and evaporates from the soil surface (soil evaporation) and the plant’s leaves (leaf transpiration). In simple terms, ETc is the amount of water lost by a cropped surface. When daily ETc is known for a specific crop, producers can use this information for irrigation purposes. For example, assuming the crop is at the peak of water demand and the average daily ETc is 0.2 inches/day, the amount of water withdrawn in three days is 0.6 inches. Suppose a typical farmer’s strategy is to apply 0.6 inches in irrigation water in each irrigation event. In that case, he or she will conduct irrigation every three days, assuming that rainfall is lacking.
Although estimating ETc is easy, the daily ETc changes considerably during the growing season. The plant growth stage and weather conditions dictate the amount of water withdrawn by a cropped surface. Figure 1 shows the average daily corn ETc values considering 21 years of historical average values and daily ETc values for the 2012 growing season at a location in the northwest region of Alabama. Lower ETc values occur early in the growing season (early vegetative growth stages) and late in the growing season (maturity) compared to when they occur in the reproductive growth stages (mid-season). These differences are mainly dictated by the water requirements of the corn plants at specific growth stages. Larger ETc values are expected during the reproductive stages as they require large amounts of water during grain filling. There are noticeable ETc value differences between 2012 and the historical average. These differences show the impact of weather conditions on daily ETc. The 2012 growing season was hot and dry, and plants required larger water amounts during the reproductive stages compared with the historical average daily ETc. These differences also emphasize that although using historical average ETc values to support irrigation scheduling is a good approach, the determination of daily ETc based on actual weather conditions and plant growth for each specific growing season is required to avoid under or overirrigation settings.
Evapotranspiration-Based Irrigation Scheduling
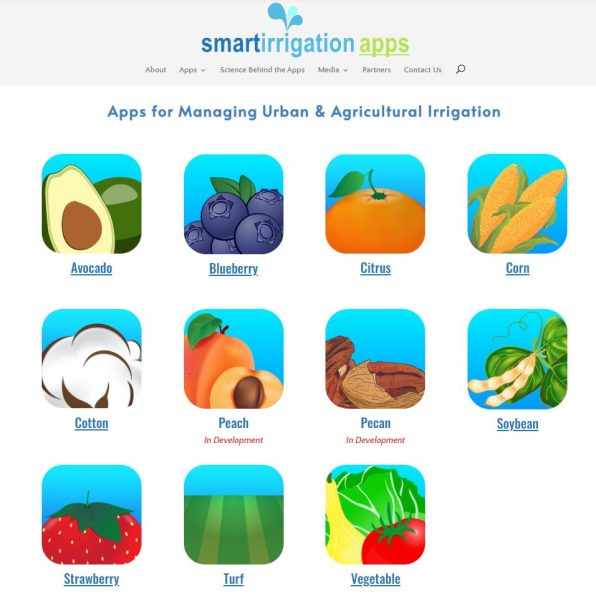
Figure 2. The smartirrigation app is available for several crops.
This irrigation scheduling method uses the water balance approach to recommend irrigation amounts and timing based on estimated daily ETc and recorded daily rainfall. The water balance approach is a simple mathematical equation that accounts for water input (rain and irrigation) and output (ETc) to determine the amount of water depleted in a soil profile. This method recommends irrigation when a maximum allowed soil water depletion (SWD) is reached. That is, it allows the soil to deplete to a specific water level before the crop is assumed to be under water stress. The irrigation amount is then calculated to return SWD back to zero.
Many decision support tools for ETc-based irrigation have been developed for several crops. Examples are the smartirrigation apps (www.smartirrigationapps.org) and Irrigator Pro (https://irrigatorpro.org/). Although each tool uses the water balance approach as the main component for recommending irrigation scheduling, they differ on a few features. For example, the smartirrigation apps use rainfall data from several sources selected by the user and estimate growing degree days from weather data. This information is then used to select a crop coefficient for the ETc estimation. Irrigator Pro incorporates soil sensor data along with crop coefficient to determine daily crop water use and available soil water, which improves irrigation recommendations’ determination. The following sections cover the operational aspects of each ET-based irrigation scheduling tool.
Smartirrigation Apps
The University of Georgia developed the smartphone irrigation apps (SIA) for several crops including row crops, turf, fruits, and vegetables (Figure 2). As previously mentioned, these SIAs estimate irrigation requirements during the growing season using the water balance approach. Rainfall and irrigation water inputs and ETc water output parameters are used for the water balance calculations. The growing degree days information and reference evapotranspiration are calculated from weather data. The growing degree days information is used to select the crop coefficient that will be multiplied by the reference evapotranspiration to estimate ETc.
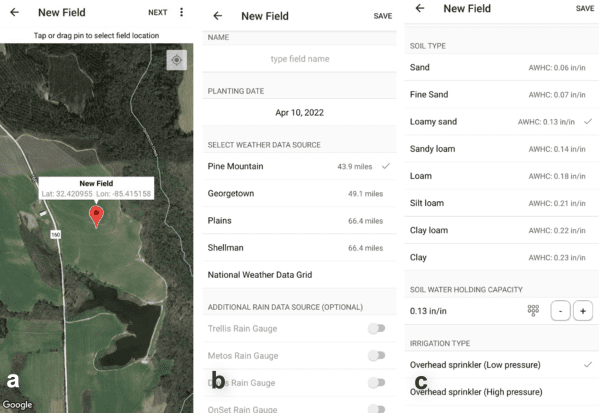
Figure 3. Screenshot with field (a) weather station, (b) optional rainfall data source (c) and soil type selection on the smartirrigation app.
When creating a field (Figure 3a), the user is asked to select several parameters that will influence the ETc estimation and dictate the rainfall data’s main source, ultimately influencing the water balance calculations. As the field location is selected, the user has the option to select a nearby weather station from the University of Georgia, University of Florida, or Mississippi weather networks or use the national weather data grid as the main source of weather data needed for the ETc estimation and rainfall data input. The ETc estimation is less sensitive to changes for different options of weather station selection; however, rainfall is well known for large variability within a few miles radius. These SIAs allow the user to input rainfall data recorded at the field (Figure 3b), which can substantially improve the water balance calculations. If the user has a rain gauge from the manufacturers listed in Figure 3b, the rainfall data will be automatically uploaded to the SIA. Another option is to install a manual rain gauge and manually input rainfall data into the app daily. Alabama farmers interested in using this app can select the option of the national weather data grid as the source of weather information and manually input rainfall data collected in their fields. If the field is close to one of the Alabama Agricultural Experiment Stations, farmers can contact the authors of this publication to access the weather data collected by one of the automatic weather stations installed across the state.
Users are also asked to select the predominant soil type. This selection dictates the soil available water- holding capacity (AWHC, Figure 3b). This is another key piece of information used by the app to recommend irrigation. AWHC describes the amount of water the soil can hold in a soil profile. The larger the AWHC, the more water a soil can hold. Irrigation is recommended when the soil water level reaches a maximum allowable deficit. Users can adjust the maximum allowable deficit value based on crop growth stage or if they know the expected rainfall.
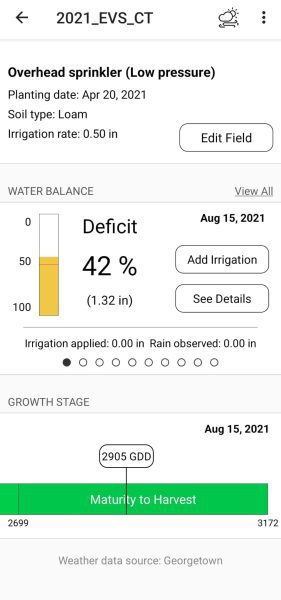
Figure 4. Smartirrigation corn app user’s interface for a farm near Shorter, Alabama.
Figure 4 shows an example of the smartirrigation corn app for a farm close to Shorter, Alabama, during the 2021 growing season. The interface provides information regarding the soil water conditions in terms of deficit (42 percent) and water depletion (1.32 inches) as well as information related to the crop growth stage and growing degree days (GDD at 2905 degrees F). These values change daily according to the weather conditions and plant development during the growing season. This information can be used to support irrigation decisions during the growing season.
Irrigator Pro
This SIA has been mainly developed developed by the USDA National Peanut Laboratory for peanuts but can also be used on corn and cotton. This section will cover the tool available for peanuts only. The tool is available as a smartphone app or as a web interface. The main advantage of using this SIA is the opportunity to link the information from the soil sensor data to enhance the irrigation recommendations. The baseline data used by this SIA are historical suggested daily ETc values based on each growth stage (Figure 5). Weekly in-field growth stage assessment, especially fruit initiation based on pin count number, is key to estimating the correct crop coefficient and subsequent tool performance, as it uses this information to estimate the daily soil available water content (AWC) and then irrigation recommendations. The tool includes a peanut fruit initiation calculation option that allows the user to estimate this date correctly.
Figure 5 shows ETc values ranging from 0.07 (early and late growth stages) to 0.29 inches/day (pod filling, addition, and maturation growth stage), and the duration of each growth stage as shown in the examples of a peanut grown in south Alabama in 2021.
Although AWC is calculated based on fixed ETc values per growth stage, the tool also allows the user to add soil sensor data to be more accurate on the AWC determinations. Figure 6 shows the recommended values provided by Irrigation Pro for a selected period between August 27 and September 9, 2021. In this example, soil sensor data was used to determine daily AWC and better provide an irrigation initiation recommendation. The tool was not recommending irrigation from August 29 to August 3 since the AWC was substantially above daily water use. On September 1, the tool suggested irrigation as AWC was approaching zero and far from DWU. After a rainfall event that occurred September 5, AWC increased, and the tool recommendation was not to irrigate.

Figure 5. Growth stage and daily water use (DWU) for a peanut crop during the 2021 growing season.
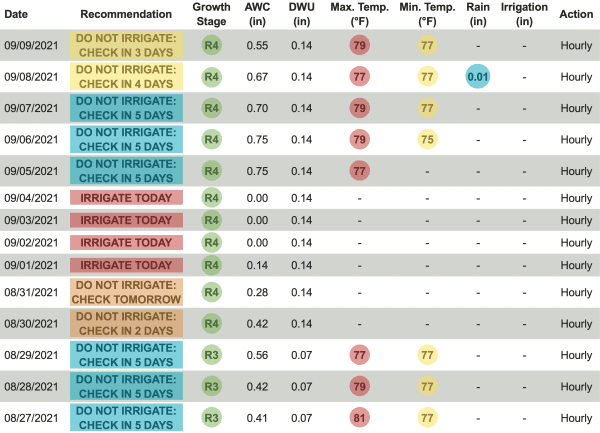
Figure 6. Daily irrigation recommendations provided by the Irrigator Pro during the 2021 growing season on a field in south Alabama. AWC is available water content in the soil profile and DWU is daily water use (or ETc).
FieldNET Advisor
FieldNET is a cloud-based, automated irrigation scheduling tool that uses crop and root growth models to run a daily soil water balance to determine when, how much, and where to irrigate. The tool tracks available soil water, forecasts crop water needs, estimates the amount of yield lost to water stress, creates a map of the water available to the crops, and automatically generates variable rate prescription maps. The user only needs to enter information such as crop type, planting date, and soil map. The tool is linked to the center pivot irrigation system and every time the irrigation system is used to irrigate the crop, irrigation information is automatically recorded. This tool provides access to daily irrigation recommendations and variable rate irrigation prescription maps that can be directly uploaded from the web tool to the center pivot irrigation system.
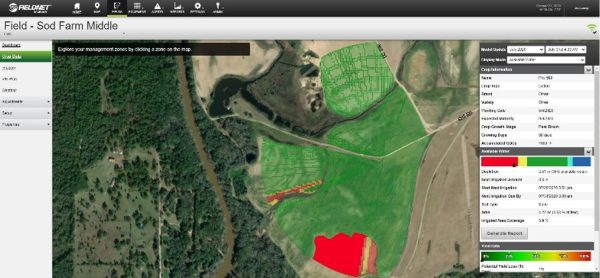
Figure 7. Irrigation scheduling recommendations from FieldNET Advisor that supports variable rate irrigation.
Evaluation of an SIA
At the same field where an SIA was evaluated for corn irrigation scheduling, a set of three soil moisture sensors were installed at 6-, 12-, and 24-inch soil depths, and the soil water storage (SWS) at the 24-inch soil depth was determined during the 2021 growing season (Figure 8a). Sensors determined the water amount withdrawn by corn plants due to ETc (decrease on SWS) as well as the SWS increase due to the irrigation and rainfall events. Figure 8b highlights the period between 91 and 104 days after planting (DAP). The step pattern from 95 to 102 DAP, no SWS changes during the night, and the decrease of SWS during the day represents the amount of water lost in the soil profile. Each step represents daily ETc, as highlighted in Figure 8b.
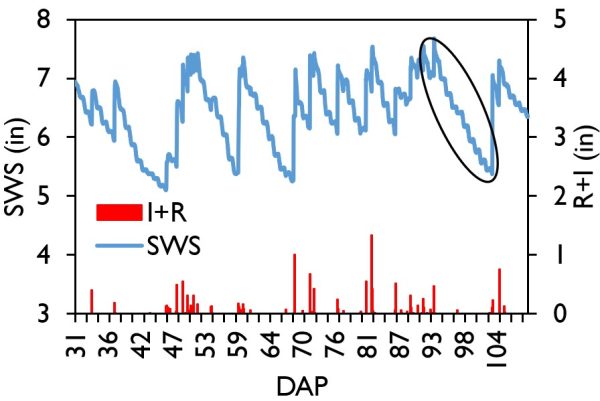
Figure 8a. Changes in soil water storage (SWS) at a depth of 24 inches and rainfall plus irrigation (R+I) values during the 2021 corn growing season.
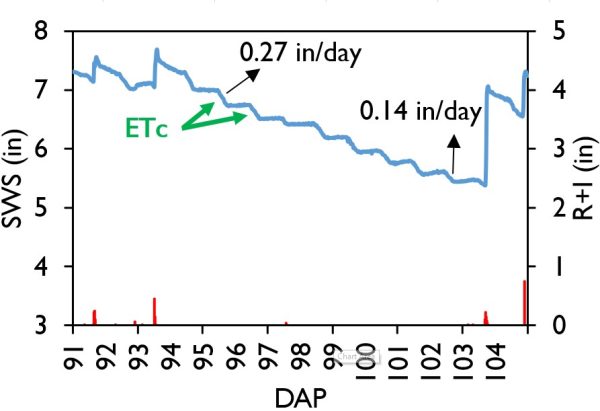
Figure 8b. The specific period between 91 to 104 days after planting (DAP) at Shorter, Alabama. DAP is days after planting and ETc is daily crop evapotranspiration.
Table 1 shows the comparison between ETc estimated by an SIA and measured by the soil moisture sensor. The app provides daily results and the cumulative ETc values for the period from 95 to 102 DAP. Daily ETc was similar between SIA and soil moisture sensors, with an average of 0.195 and 0.186 inches/day, respectively. These similarities resulted in an 8-day cumulative ETc of 1.55 inches estimated by an SIA and 1.49 inches measured by the soil moisture sensors. The largest difference was observed on 97 DAP, in which daily ETc was underestimated by 0.11 inches by an SIA in relation to the soil moisture sensor. These findings indicate that this SIA could accurately estimate daily ETc, showing its potential as an irrigation scheduling support tool.
Table 1. Daily and Cumulative Crop Evapotranspiration (ETc)
| DAP | Daily ETc - SIA | Daily ETc - SS | Daily ETc - Δ | Cumulative ETc - SIA | Cumulative ETc - SS | Cumulative ETc - Δ |
|---|---|---|---|---|---|---|
| 95 | 0.27 | 0.20 | 0.07 | 0.27 | 0.20 | 0.07 |
| 96 | 0.22 | 0.20 | 0.02 | 0.49 | 0.40 | 0.09 |
| 97 | 0.10 | 0.21 | -0.11 | 0.59 | 0.61 | -0.02 |
| 98 | 0.23 | 0.17 | 0.06 | 0.82 | 0.78 | 0.04 |
| 99 | 0.24 | 0.19 | 0.05 | 1.05 | 0.97 | 0.08 |
| 100 | 0.20 | 0.18 | 0.02 | 1.25 | 1.15 | 0.10 |
| 101 | 0.16 | 0.16 | 0.00 | 1.41 | 1.31 | 0.10 |
| 102 | 0.14 | 0.18 | -0.04 | 1.55 | 1.49 | 0.06 |
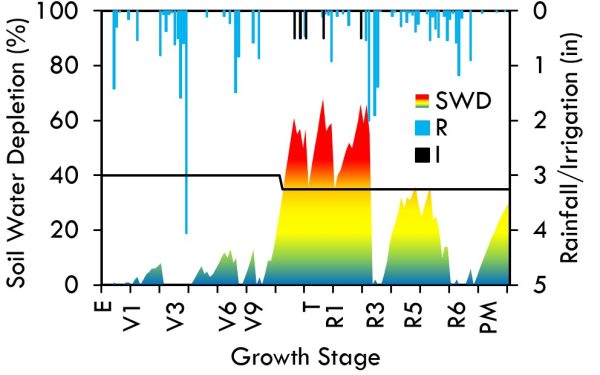
Figure 9. Soil water depletion (SWD) estimated by an SIA used to trigger irrigation (I) during the 2021 corn growing season at Fairhope, Alabama.
R = rainfall
E = emergence
V = vegetative growth stage
T = tasseling growth stage
R1–R6 = reproductive growth stages
PM = physiological maturity
Figure 9 shows another example of estimated SWD by the corn SIA during the 2021 growing season in Fairhope, Alabama. The irrigation initiation thresholds selected for this field were 40 percent SWD from early growth stages until V12 and 35 percent SWD from V12 to silking (peak of water demand). The peak of water demand occurred while rainfall was lacking (Figure 9). The app recommended irrigation during these periods to avoid crop water stress. It is important to emphasize that this app does not account for the time required for the excessive water to drain in the soil profile after a heavy rainfall event or several days of continuous rainfall. Due to this issue, the app might suggest a higher SWD than the actual field condition. For example, the first irrigation happened right before tasseling, 12 days after the last recorded rainfall event. However, the app was recommending irrigation one week after the rainfall (value was approaching the 35 percent SWD threshold) even though the field was still under saturation because of the heavy rainfall. One strategy to account for these events is to recommend that users manually add artificial rainfall into the app until saturation or water ponding are no longer observed. Growers should always look at the actual field condition while using an irrigation scheduling tool to avoid either over or under application of irrigation water. Overall, this app was a good tool to support irrigation scheduling decisions. For this specific evaluation, the irrigation recommendations by the app agreed with the days the farmers, based on their experience, decided to apply irrigation which in this case was five times.
Conclusions
- Determination of the best irrigation amount and timing is constrained by several aspects related to soil and weather conditions and plant development.
- Many ETc-based irrigation scheduling tools have been developed to support and facilitate irrigation decisions for many crops. The smartirrigation apps, the Irrigation Pro, and the FieldNET Advisors are examples of tools that can be used for irrigation.
- The corn and cotton smart irrigation phone apps have been evaluated at several locations in Alabama, and the irrigation recommendations, especially at
the peak of crop water demand, agree with other irrigation scheduling methods like soil sensors. - Farmers or crop consultants without experience with irrigation scheduling could start using the smartirrigation apps or Irrigation Pro as entry level tools to irrigation scheduling.
- Users should always check the actual soil water conditions and the plant water status while using these irrigation scheduling tools, so the determination of irrigation amount and timing are more accurately assessed.
References
- Butts CL, Sorensen RB, Lamb MC. 2020. Irrigator Pro: Progression of a peanut irrigation scheduling decision support system. Applied Engineering in Agriculture. 36(5): 785-795.
- Migliaccio KW, Morgan KT, Vellidis G, Zotarelli L, Fraisse C, Zurweller BA, Andreis JH, Crane JH, Rowland DL. 2016. Smartphone apps for irrigation scheduling. Transactions of the ASABE. 59(1): 291-301.

 Bruno Lena, former Postdoctoral Fellow; Brenda Ortiz, Extension Specialist, Professor, Crop, Soil, and Environmental Sciences; and Guilherme Morata, Regional Extension Agent, Agronomic Crops, all with Auburn University
New August 2022, Crop Evapotranspiration Irrigation Tools, ANR-2914