Crop Production
Specific steps must be followed when installing soil sensors to ensure accurate data collection and good irrigation decisions. Best practices for soil sensor installation are covered.
Use of soil sensors for irrigation scheduling is needed in irrigated agriculture. Soil sensors provide data on soil water status that is used to determine irrigation timing and amount. The quality of the data received is dependent on proper installation of the sensors. If a sensor is not correctly installed, it will provide misleading information and result in inaccurate irrigation scheduling.
The crop type being irrigated and the soil heterogeneity in depth and space have to be considered when installing soil sensors. Sensors need to be located at the depth where the majority of the root system resides and at sites representing the irrigated field. Having soil sensors at various soil depths can provide data on changes in soil water and plant water uptake throughout the growing season. Early in the season, soil sensors should monitor one-third of the depth of the root zone, but at the peak of crop water use, they should monitor at least two-thirds of the crop root zone (Rix et al., 2020).
Many commercial soil water sensors are available. Most companies also provide tools, such as smartphone apps and websites, that facilitate soil sensor data interpretation to support irrigation decisions. Examples of soil sensors are soil matric potential sensors (figure 1), capacitance sensors (figure 2), and time-domain reflectometry-based (TDR) sensors (figure 3). Each sensor has its advantages and limitations; farmers or consultants should decide which type of sensor fits their needs better. For example, TDR sensors are well known to provide accurate volumetric water content data, but the installation process may be more complex than soil matric potential or capacitance sensors.

Figure 1. Soil matric potential-based sensor, such as Watermark
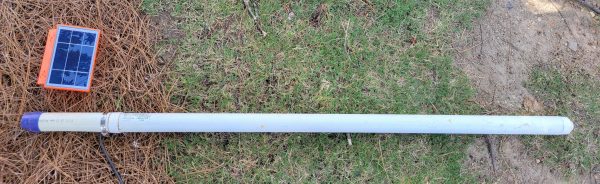
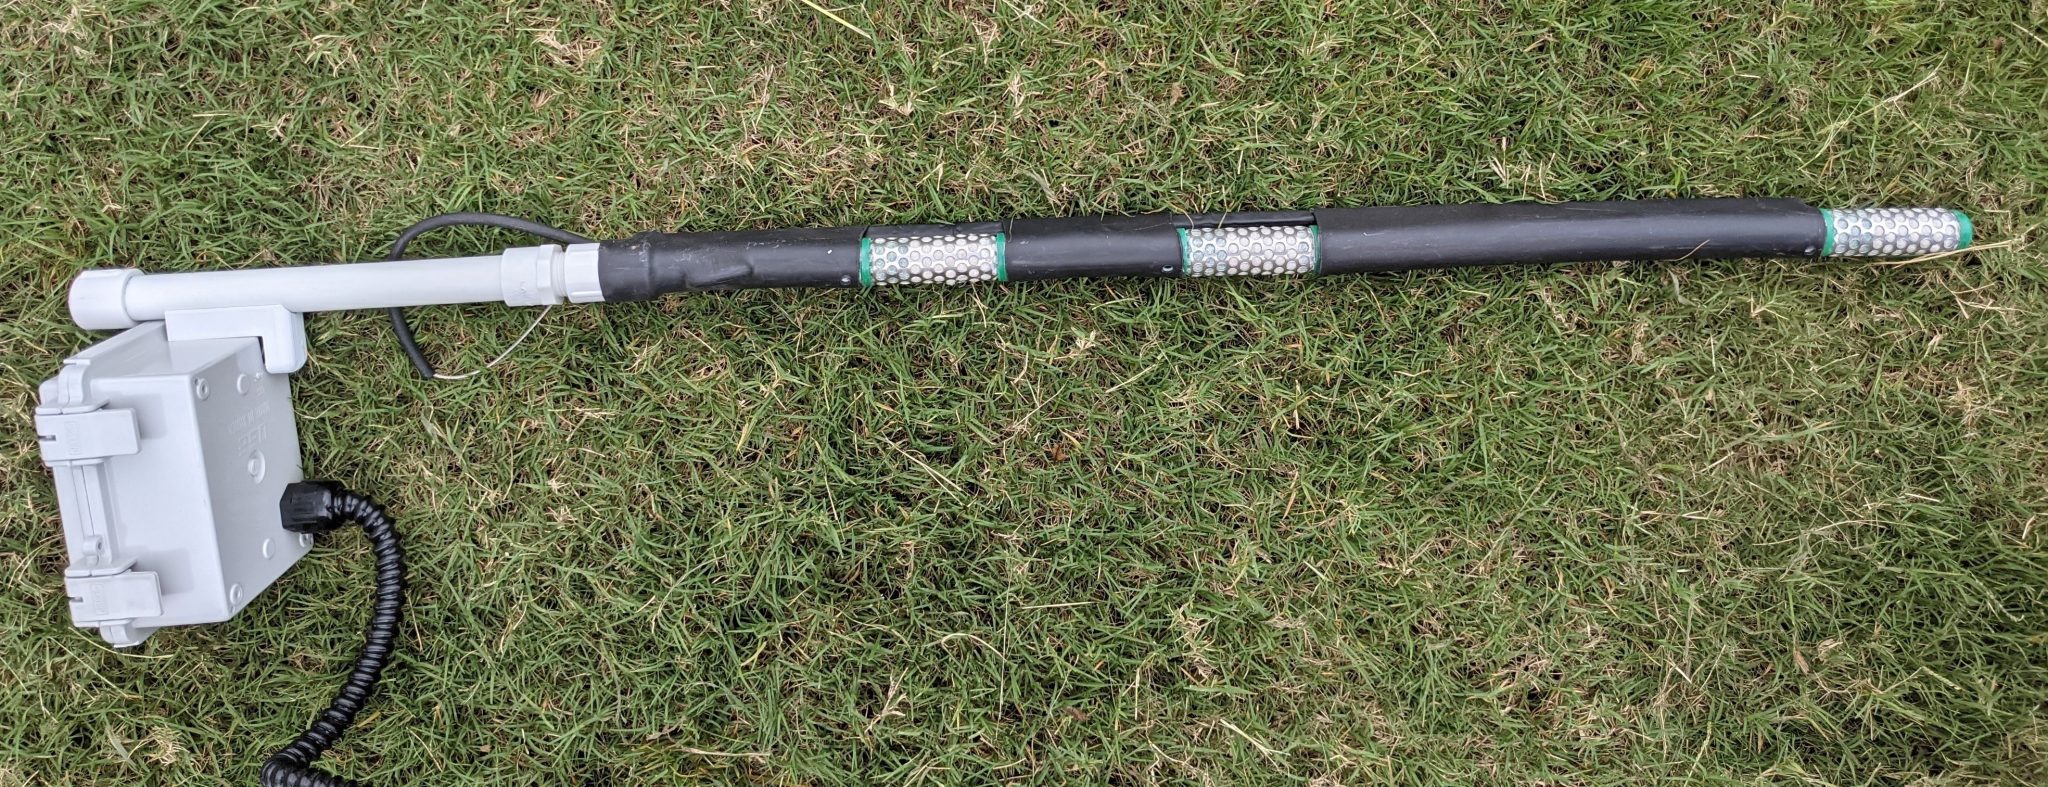
Figure 2. Capacitance-based sensor, such as AquaSpy
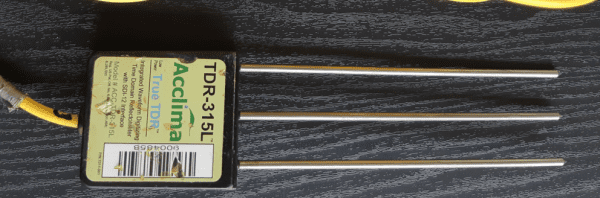
Figure 3. Time domain reflectometry-based sensor, such as Acclima True TDR
Soil Sensor Installation Considerations
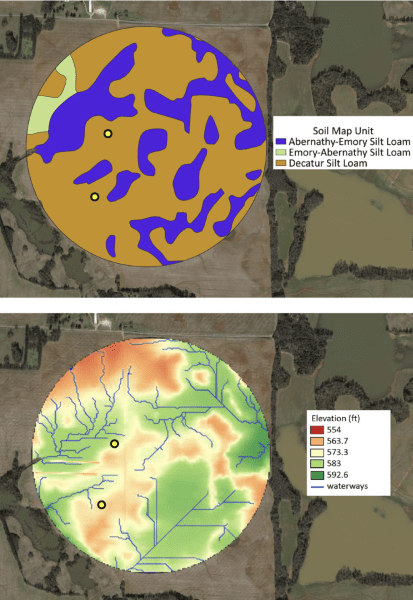
Figure 4. Soil texture map with soil series map (top) and terrain elevation map showing the waterways (bottom) of a 300 acre field. Yellow dots are suggested locations for soil sensor installation.
Sensor location is critical. Within-field variability in soil type and/or terrain elevation is common in many crop fields. If significant within-field variability exists, more than one sensor should be installed based on management zones having uniform soil water storage characteristics. If the decision is to use only one sensor per field, the sensor should be installed at a location that represents most of the field conditions. Some farmers, for example, install a sensor at a location representing the greatest terrain elevation within a field because that area dries out faster; they use that data as their guide for irrigation timing. Those locations, however, do not always represent the average field conditions.
A soil sensor installed in the wrong place could result in over- or underapplication of irrigation. If a field exhibits significant changes in terrain elevation, avoid installing the sensor on waterways; frequent surface or subsurface water flow along these areas might not represent the average of the field’s soil moisture condition. Selecting a homogeneous spot in the field where plants are not stunted is also very important.
Figure 4 shows the soil texture with soil series and terrain elevation maps from a 300-acre field. This information can be used to assess field variability. The soil texture map (figure 4, top) was retrieved from the Natural Resources Conservation Service (Web Soil Survey, n.d.), a free platform. Terrain elevation maps can be generated from the Real Time Kinematic (RTK) GPS data collected at the time of planting or harvest (figure 4, bottom).
Combining the information from both maps allows identification of potential locations for soil sensor installation. While a soil texture map can determine the predominant soil texture in which soil sensors should be installed, the terrain elevation map will show the waterways where sensor installation should be avoided. The yellow dots in figure 4 (bottom) indicate locations that avoid waterways, access roads, and the first and last spans of the center pivot, while those in figure 4 (top) indicate a predominant soil texture for the field.
Soil Sensor Installation Process
Following are key aspects to sensor installation:
- Select a location that represents the majority of the crop growing conditions on the field.
- Install the sensor in between two plants within the crop row.
- During sensor installation, avoid damaging the plants that will be in close proximity to the sensor.
- Ensure there is good sensor-to-soil contact.
- Avoid air pockets between the soil and the sensor.
- Avoid installing the sensor in a waterway.
- Check manufacturer’s instructions for installation; some sensors, especially soil matric potential-based sensors, must be placed in water for 24 hours prior to installation.
- Install soil sensors 20 to 30 days after planting.
Although the exact installation method used depends on the soil sensor type, there are standard installation steps to follow that improve installation for the most common sensors used in irrigated fields in Alabama.
Soil Matric Potential-Based Sensor and Capacitance Sensors Installation Guidelines
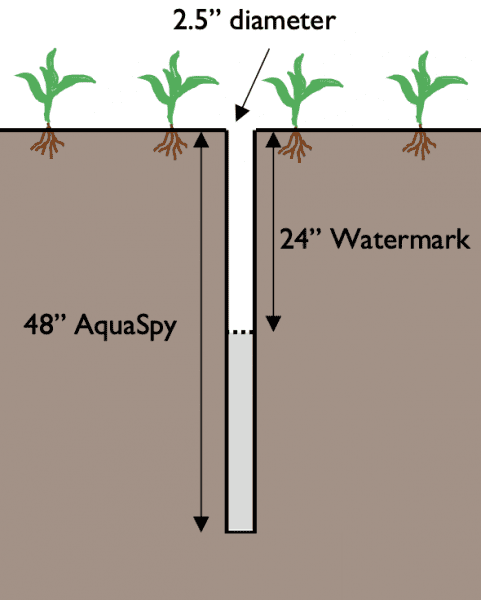
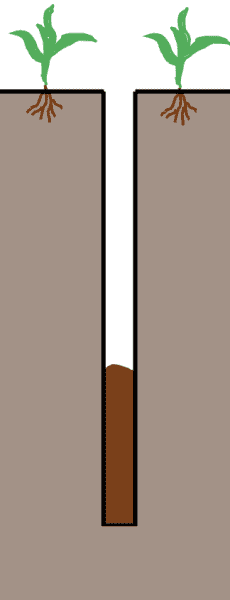
Figure 5. Steps 1 and 2 of the soil matric potential-based sensor or capacitance soil sensor installation.
The installation process for these types of sensors is very similar. The main difference is the probe size: 24 inches for a soil matric potential-based sensor and 48 inches for capacitance sensor.
Step 1 (figure 5). Dig a hole between two healthy plants that is slightly bigger than the sensor diameter (2.5 inches capacitance) and up to the deepest target depth for monitoring (48 inches for capacitance-based sensor). You can use a manual or engine-powered auger. Be careful not to open an oversize hole; air gaps will result in erroneous data.
Step 2 (figure 5). Fill the bucket with soil extracted from the hole. Mix with water and create a slurry. Avoid particles such as small rocks and plant residues. Thick slurry might create air gaps close to the sensor. A thin slurry might crack more easily if the soil dries out, creating air gaps and preferential water flow.
Step 3 (figure 6). Pour slurry up to one-third of the hole depth. If the slurry is too thick, the bottom of the hole will be compacted by the probe. If the slurry is too thin, the slurry around the sensor will certainly crack as soil dries out, creating air gaps. For light soil with high sand content, pour slurry after inserting sensor.
Step 4 (figure 7). Insert the probe into the hole. Make sure there is excess slurry coming from the hole while the probe is inserted. Shake probe firmly while inserting into the hole; this helps to remove small air gaps, especially for heavy soils. Insert probe fully into the ground.
Step 5 (figure 8). Remove excess slurry. If necessary, insert a thin object through the slurry to remove air gaps. After removing excess slurry, put some dry soil on the topsoil to close the hole; this will prevent soil cracking and preferential flow of water through the hole.
-
- Figure 6. Step 3 of the soil matric potential- based sensor or capacitance soil sensor installation.
-
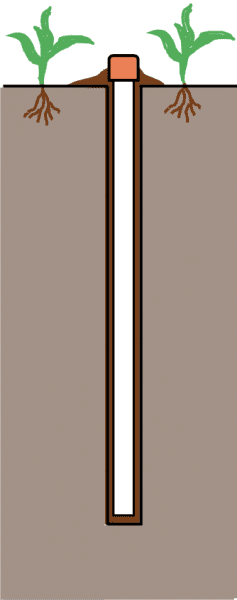
- Figure 7. Step 4 of the soil matric potential- based sensor or capacitance soil sensor installation.
-
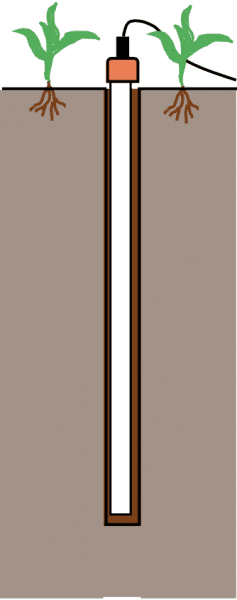
- Figure 8. Step 5 of the soil matric potential- based sensor or capacitance soil sensor installation.
TDR Sensor Installation Guidelines
Step 1 (figure 9). Open an 8-inch-diameter pit using an engine-powered auger. The pit wall should be 2 to 3 inches from plants to avoid damaging the root system. A lot of soil could come out of the pit when digging the hole with an engine-powered auger; this can easily damage the plants. It is recommended that you cover the plants with 5-gallon buckets to prevent breaking plants. Avoid compacting loosened soil that is coming out of the pit; this will facilitate the soil reconstruction process.
Step 2 (figure 10). Insert TDR sensors horizontally with respect to the soil surface and perpendicular to the crop row. Use the installation guide provided by the manufacturer to prevent sensor rods from bending and ensure that rods are evenly separated during installation. Sensor readings will be affected if rods get bent. Install sensors from bottom to top; alternatively, the bottom sensor can be installed vertically. Repact soil using the same soil order/type extracted from the hole. Position cables on the opposite side of the pit where the sensor was installed to prevent preferential water flow that could interfere with sensor readings.
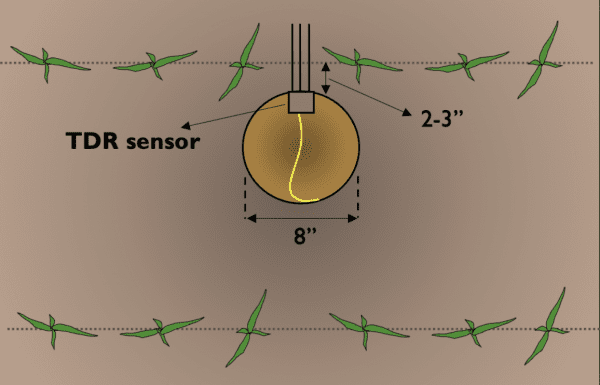
Figure 9. Step 1 of time domain reflectometry soil sensor installation.
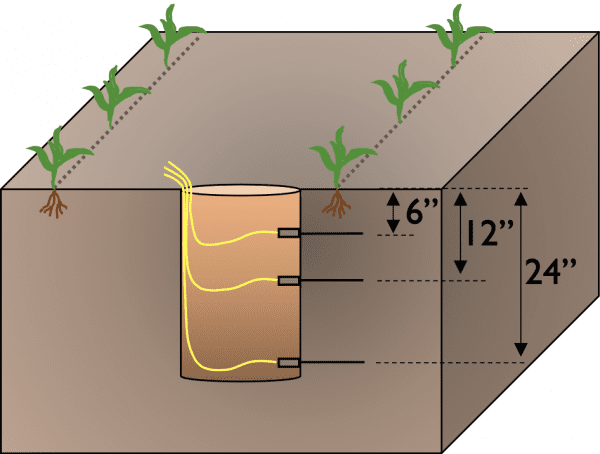
Figure 10. Step 2 of time domain reflectometry soil sensor installation.
Identifying Good and Bad Data from Soil Sensors
The main goal of sensor installation is to guarantee the quality of data collected. After installation, it remains important to check for bad or misleading data. Incorrect data could lead to bad irrigation decisions.
Identification of bad data may not be an easy task; it could be associated with various factors, such as the presence of air gaps near the sensor. Air gaps are one of the main driving factors resulting in inaccurate soil water levels.
Following are examples of good and bad soil sensor readings: one collected with Watermark sensors and the other with AquaSpy sensors.
Soil Matric Potential-Based Sensors
Soil matric potential-based sensors, such as Watermark, provide soil matric potential values, commonly referred to as “soil water tension” or “soil tension,” usually provided in kiloPascals (kPa) or centibars (cb). This sensor reads soil water tension ranging from 0 to 200 kPa; this value can be related to the water available in the soil. When soil water tension value is low (tending to 0 kPa), available soil water is high. When soil water tension is high (tending to 200 kPa), available soil water is low.
Figure 11 shows soil water tension values collected at three different soil depths (probe with three sensors) during the growing seasons of 2019 (Field 1) and 2020 (Field 2). Corn was cultivated in Field 1 and cotton in Field 2. Data show the dynamic of soil water tension considered as good (Field 1) or bad readings (Field 2).
During periods without irrigation or rainfall, soil becomes drier, and soil water tension increases as the crop extracts soil water. After rainfall or irrigation events, soil moisture increases, and soil water tension decreases sharply. Knowing the expected soil water tension dynamic in the soil profile is the first step to identifying a good or bad sensor reading.
In the example provided for Field 1, soil water tension changes followed the expected behavior. Starting on May 19, 2019, soil water tension from the three Watermark sensors was around 0 kPa, and the values increased continuously until rainfall and irrigation occurred on May 28, 2019. Additionally, soil sensors installed at depths of 6 and 12 inches showed higher increases in soil water tension than the sensor at 24 inches. These values show the ability of the soil water tension sensors to capture soil water levels at multiple depths. For this example, most of the water was extracted from the top 12 inches of soil, where most of the root system is located.
The soil water tension dynamic in Field 2 was quite different from the expected behavior observed in Field 1. Although the data was collected for different crops (corn at Field 1 and cotton at Field 2), the soil water tension changes are expected to be similar, unlike what was observed for Field 2.
From June 2 to July 14, 2020, neither irrigation nor rainfall resulted in a sharp drop in soil water tension values for all three sensors. The sharp drop was observed only on July 16, when an accumulated rain- fall event of 4 inches occurred between July 15 and 16. The same trend was observed between July 17 and August 23, 2020, and between August 25 and September 15, 2020.
The fact that the soil water tension values were only responding to heavy rainfall events was explained by bad soil sensor installation. Field 2 had poor sensor- to-soil contact at the three soil sensors; this allowed small cracks or air gaps to form around the sensors. The presence of air around the sensors, even in small portions, results in soil sensors presenting lower available water than observed in the soil. If a similar scenario is observed, users should either reinstall the soil sensors or rely on other irrigation scheduling tools to conduct irrigation.
Field 1 — Sensors with Good Data
- Proper sensor-to-soil contact resulted in appropriate soil water tension values.
- Soil water tension became higher because of crop water use and became lower because of rainfall or irrigation.
- Higher soil water tension values at 6 and 12 in soil depth than at 24 in indicates that most of the crop water use occurred at the top 12 in of soil.
- Soil water tension helped to identify when to start irrigation — values approaching 100 kPa.
Field 2 — Sensors with Bad Data
- Air gap or soil cracks around the soil sensors was identified.
- It resulted on little responsiveness of the soil water tension sensors located at 8, 16, and 24 in soil to irrigation or rainfall.
- Soil water tension value only dropped to 0 kPa after big rainfall event, meaning that the soil was fully saturated.
- False positive signal of plant water stress was recorded during most of the growing season with soil water tension values above 100 kPa.
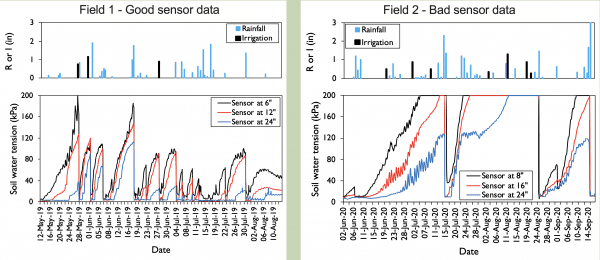
Figure 11. Dynamic of soil water tension values, irrigation (I), and rainfall (R) during the 2019 corn growing season (left) and 2020 cotton growing season (right) at different soil depths.
Capacitance-Based Sensors
Figure 12 shows available moisture collected from early June to mid-July of the 2020 growing season by two capacitance-based sensor probes, such as AquaSpy, installed in two corn fields. The full point (blue line) is considered the field capacity, while the refilling point (red line) is the available moisture value at which yield is expected to be reduced substantially. The green band is the adequate available moisture level that prevents water stress and, as a consequence, crop yield losses.
When using this soil sensor for irrigation scheduling, keep available moisture within the green band and irrigate to increase available moisture to the full point. The water level in the soil profile from capacitance- based sensor probes is collected every 4 inches up to 48 inches soil depth.
At Field 1, it was found that the probe installed had air gaps around the top two sensors (4- and 8-inch soil depth), while the probe installed at Field 2 was installed without air gaps. The manufacturer suggested two options: (1) exclude the top two sensors from the calculations of the available moisture for the entire soil profile or (2) reinstall the probe. The first option was chosen in order to evaluate the impact of air gaps in the sensor reading.
The dynamic of available moisture between the two fields was quite different. The rate of daily reduction in available moisture, represented by the daily step pattern, at Field 1 was much lower than at Field 2.
The lower responsivity of the Field 1 probe was because the 4- and 8-inch soil depth sensors were discarded. The topsoil is where most water availability changes occur due to evaporation and plant water uptake. With the top two sensors unable to capture changes in daily water levels, the probe could not capture small increments of available moisture change caused by small rainfall events. Consequently the data provided by the probe may not accurately represent the 48-inch soil profile and therefore lead to poor irrigation decisions.
The fact that available moisture was kept within the optimum zone (green area in the figure) for the entire growing season gives the impression that irrigation was not needed in Field 1. However, visual analysis of this crop during the growing season showed that the plants were clearly under stress, suggesting that the sensor was not adequately capturing the soil water level. Field 2, on the other hand, is a good example of adequate readings, wherein available moisture increased due to irrigation or rainfall events and decreased because of daily crop water uptake. Identifying any potential issues early in the growing season is key to preventing over- or under-irrigation that could result in yield losses or water application inefficiency.
One strategy used to identify misleading information coming from soil sensors is to assess signals of plant water stress from the irrigated crops. For example, a corn plant can uptake about 0.25 inch of water daily during the peak of water demand, resulting in 1.5 inch after six days. If a soil profile can hold 3 inches of water, the soil water depletion at the end of four days would be 50 percent. At this depletion level, it is assumed that plants will start showing signals of water stress; therefore, the soil sensor data should be recommending irrigation. If the soil sensor suggests that irrigation is not needed, this sensor should be reinstalled or not used for further irrigation scheduling. These prescriptions also can be influenced by compaction of poor drainage. Therefore, using soil sensors does not eliminate visiting the field and checking on the crop.
Field 1 – probe with air gaps
- Air gaps were found surrounding the sensors placed at 4- and 8-inch soil depth.
- Irrigation and rainfall or daily crop water uptake resulted in lower sensitivity to changes in soil water levels.
- Crop water uptake (step pattern) for three-day period was only 13%.
- A false positive signal of well-watered plants throughout the growing season was observed.
- Values never went below the green band.
- This scenario could have resulted in underirrigation and yield losses if this issue was not identified.
Field 2 – probe without air gaps
- Sensors were very responsive to changes in water levels.
- Crop water uptake changed about 40% in a three-day period.
- Available moisture got close to the green zone at various times during the growing season.
- This probe made possible timely irrigation recommendations.
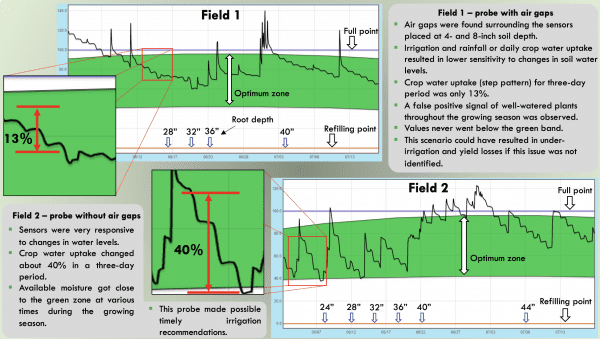
Figure 12. Dynamic of available water values determined using capacitance-based soil sensors at two corn fields during the 2020 growing season.
Conclusions
- Assessing a field’s predominant soil type and terrain elevation is required to identify the best location for soil sensor installation.
- Irrigation can be successfully managed using soil sensors if best practices were adopted when installing them.
- Bad soil sensor installation leads to misleading information and poor irrigation decisions.
- Interpretation of the soil sensors data during the growing season is also necessary to identify potential issues.
References
- Rix, J., H. Lo, D. Gholson, and M. Henry. 2020. “Irrometer Watermark Series: Irrigation Triggers.” Extension Service of Mississippi State University. Publication 3541: 10–20.
- Web Soil Survey. n.d. Natural Resources Conservation Service, United States Department of Agriculture. http://websoilsurvey.sc.egov.usda.gov. Accessed 06/01/2021.
Funding
- Alabama Soil and Water Conservation Committee
- USDA-NRCS-CIG agreement no: 69-3A75-17-273
 Bruno P. Lena, Postdoctoral Fellow, Crop, Soil, and Environmental Sciences; Guilherme Trimer Morata, Regional Extension Agent, Agronomic Crops, and Brenda V. Ortiz, Extension Specialist, Professor, Soil and Agronomic Crops, all with Auburn University
New August 2021, Installation of Soil Sensors for Irrigation Scheduling, ANR-2775