Crop Production
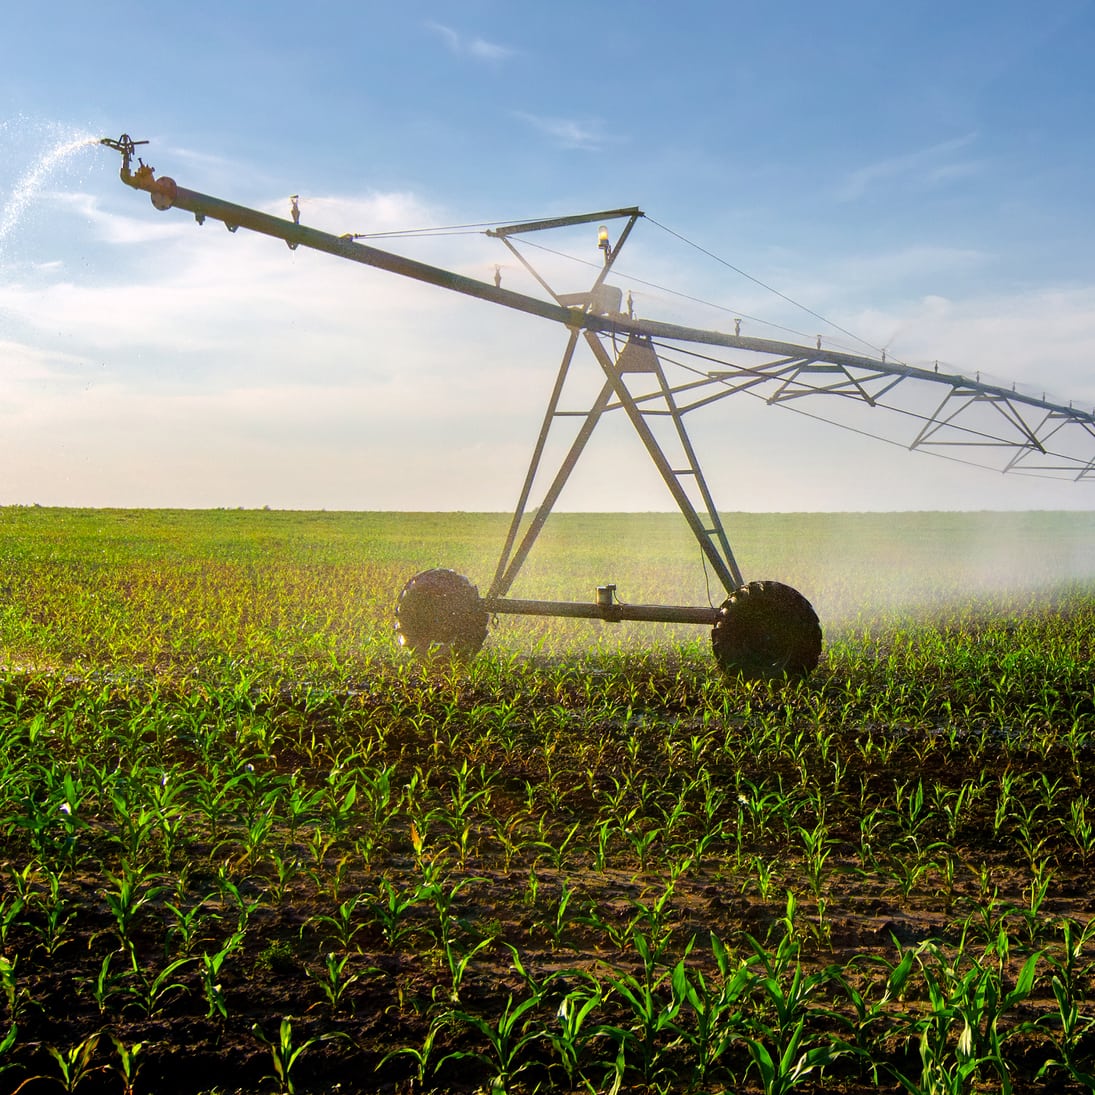
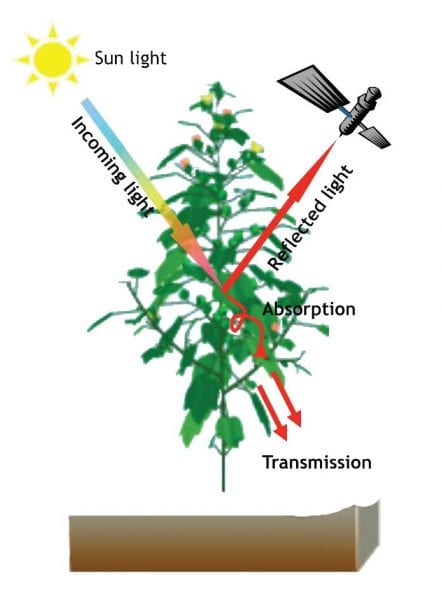
Figure 1. Remote Sensing consisting of: object’s illumination, light reflection and/or absorption, and light transmission through the atmosphere.
Remote sensor technology is used to detect subtle differences in vegetation that may be overlooked using typical visual methods. Learn how the technology works to elevate accuracy in evaluating and managing crops.
Advances in technology have made it possible to use instruments called remote sensors to collect data from and about objects without having to make any physical contact with those objects. In agriculture, remote sensors are commonly used to gather data about plants and soil. They are placed above the object, or target, to collect data that is often otherwise undetectable. In addition, sensors can collect data from large areas very quickly with relatively short collection intervals, thus reducing the amount of time spent manually collecting data. This technology is facilitating growers’ adoption of more precise agricultural strategies, which optimize input decisions for the best time, place, and amount.
How does a remote sensor work?
Most remote sensors used in agriculture measure the amount of light reflected and/or emitted from the object (figure 1). Light, whether man-made or natural, is composed of different portions of electromagnetic (EM) radiation energy classified by wavelengths in the EM spectrum (figure 2). The EM spectrum ranges from short wavelengths (including gamma and x-rays) to longer wavelengths (including microwaves and radio waves). Visible (VIS) wavelengths, or light seen as color by the human eye, only exist in a narrow range from about 400 to 700 nanometers (nm) (figure 2). Emittance or reflectance in a specific wavelength range of the EM spectrum is sometimes referred to as a spectral band. In growing plants, the amount of reflected light at specific wavelengths is sometimes associated with chlorophyll content or plant health. Plants appear green because chlorophyll in the leaves absorbs much of the incident light in the VIS wavelengths, particularly the blue and red, while the green color is reflected.
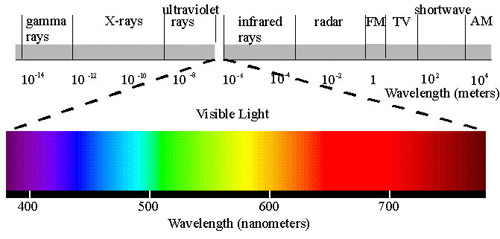
Figure 2. The electromagnetic (EM) spectrum. http://www.sati-magingcorp.com/characterization-of-satellite-remote-sensing-systems.html
Therefore, light reflected by the leaves depends on the amount and various types of leaf pigments. For example, a green leaf with high chlorophyll content exhibits higher reflectance in the near-infrared (NIR) and green wavelengths than in the red wavelength (figure 3a). In contrast, a water-stressed leaf has low reflectance in the nonvisible wavelengths from about 750 to 1100 nm (figure 3b). Measuring the difference in reflected light at various wavelengths of the EM spectrum makes it possible to distinguish vegetation from soil, green and senescent vegetation, and vegetation species.
Click on images below for full scale.
-
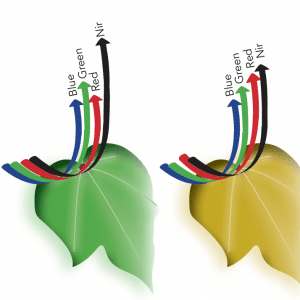
- Figure 3a. Differences in reflected light between a healthy and unhealthy leaf.
-
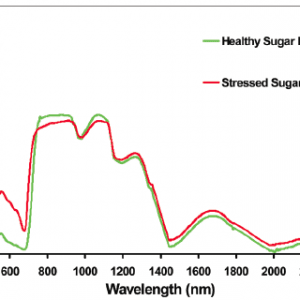
- Figure 3b. Change in spectral reflectance for a portion of the EM spectrum for a healthy sugar beet plant and one under water stress.
Characteristics of Remote Sensors
Remote sensors differ in their sensitivity to various wavelengths, the size of the objects that can be “seen,” the frequency at which data is collected, and the ability to distinguish differences in EM energy. These differences are described as spectral, spatial, temporal, and radiometric resolution and are what characterize the various remote sensing systems.
Spectral resolution is the sensor’s sensitivity to different wavelengths across the EM spectrum or the number and width of the wavelengths recorded by the sensor. Remote sensors are classified as multispectral (up to 10 broad wavelengths) or hyperspectral (up to 100 narrow wavelengths) and provide better distinctions as the number and width of sensed wavelengths increases. Figure 4 shows a multispectral image depicting specific features with four separate spectral wavelengths, or bands.
Spatial resolution refers to the sensor pixel size. A pixel is the smallest possible feature or area that a sensor can record as an individual unit. The pixel size depends on the distance between the sensor and the target, as well as on the sensor’s viewing angle, or instantaneous field of view (IFOV). The IFOV determines the area on the Earth’s surface that is visible from a given altitude at one particular moment in time. Only large features are visible from a low-resolution image (large pixel size), which has less object discrimination. In contrast, a fine- or high-resolution image (small pixel size) shows small to large objects. Figure 4 shows two sensor images with different spatial resolutions. The QuickBird image, with a higher resolution (2.4 m pixel size), depicts crop growth variability better than does the thermal infrared (IR) image with lower resolution (5 m pixel size). High-resolution images (0.5 m or smaller pixel size) are preferable for assessing within-field crop variability.
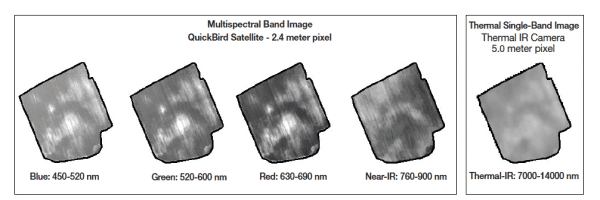
Figure 4. Spectral and spatial differences between images of two different remote sensors. Note: Images were collected from a cotton field at peak growth.
Temporal resolution is the frequency at which the data is collected and can be anywhere from minutes to weeks. Spectral characteristics of objects change over time, and collecting and comparing images at different times makes it possible to detect these changes. Keep in mind that the data collection frequency of sensors mounted on satellites and airplanes can be affected by the weather.
Radiometric resolution is the sensor’s sensitivity to distinguish differences in EM energy intensity. The finer the radiometric resolution, the more sensitive the sensor is to detecting differences in the amounts of reflected or emitted energy. The brightness of an image depends on the number of bits used to represent the sensed energy. Image brightness values on a black and white image are often represented by gray levels in a range of 0 (white) to 255 (black) (termed 8 bit).
Type of Remote Sensors
Remote sensors vary in the type of platform they are mounted on, their light source, and their spatial and spectral resolution. Mounting platforms can be commercial or government satellites, airplanes, unmanned aerial vehicles, balloons, kites, agricultural machinery, or all-terrain vehicles. The mounting platform affects the detail of the data collected (size of the objects seen by the sensor), the coverage area observed by the sensor, and the data delivery time. Table 1 lists popular sensor types used for agricultural applications.
Remote sensors are classified as passive or active depending on the light source. Passive sensors measure the amount of sun energy reflected from the objects. Because these sensors rely on sunlight, data can only be recorded when the sun is illuminating the target area and cloud cover is minimal. These restrictions often limit data collection to around noon to maximize available sunlight. Passive sensors are those mounted on satellites (Landsat or QuickBird) or airplanes (table 1). In contrast, active sensors use their own modulated light at defined or fixed wavelengths. The sensor illuminates the object and uses photodiodes to measure the portion of light that is reflected. One primary advantage of active sensors over passive sensors is their ability to obtain measurements at any time, regardless of the time of day or season, while removing the effects of sun angle and cloud cover. Active sensors include those mounted on satellites (Radarsat) or ground vehicles (GreenSeeker or CropCircle).
Table 1. Types of remote sensors that can be used for agricultural applications.
| Sensor | Platform | Light Source | Type of Data | Spectral Resolution | Spatial Resolution | Temporal Resolution | Number of Bands |
|---|---|---|---|---|---|---|---|
| IKONOS | Satellite | Passive | Multi-spectral | 400-1100 nm | 4 m | 2-3 Days | 4+ Pan* |
| QuickBird | Satellite | Passive | Multi-spectral | 450-900 nm | 2.5 m | 2-5 Days | 4+ Pan* |
| Landsat | Satellite | Passive | Multi-spectral | 450-1250 nm | 30 m | 16 Day | 7+ Pan* |
| Spot | Satellite | Passive | Multi-spectral | 500-890 nm | 20 m | 26 Days | 4+ Pan* |
| Rapideye | Satellite | Passive | Multi-spectral | 440-850 nm | 6.5 m | Daily | 5 |
| Duncan Tech Camera | Airplane | Passive | Multi-spectral | 400-1100 nm | Flight height dependent | N/A | 3-5 |
| EO-1/Hyperion | Satellite | Passive | Hyper-spectral | 400-2400 nm | 30 m | 16 Days | 220 |
| GreenSeeker | Ground vehicle | Active | Multi-spectral | 656 nm & 774 nm | 0.6 m | Hour | 2 |
| Crop Circle | Ground Vehicle | Active | Multi-spectral | Customizable-VIS & NIR | 0.6 m | Hour | 3 |
Translating Remotely Sensed Data Into Information
Remote-sensing technology has a variety of applications, including environmental monitoring, site-specific agronomic management (SSM), land cover classification, climate- and land-use-change detection, and drought monitoring (table 2). The ability of a remote sensor to detect subtle differences in vegetation makes it a useful tool for quantifying within-field variability, evaluating crop growth, and managing fields based on current conditions that may be overlooked using typical ground-based visual scouting methods. An effective method used to easily interpret remote sensing data is calculating vegetation indices( VIs) rather than using reflectance from individual spectral bands. A VI can be calculated by ratio of reflectance between two bands or ratios of differences and sums of spectral bands. VIs are often used to enhance differences in vegetation characteristics while minimizing sun illumination (in the case of passive sensors) and soil background effects.
VIs have been widely used to assess vegetation condition, cover, and growth, as well as evaluate canopy attributes such as leaf area index (LAI) and plant height. Figure 5a shows a satellite image of a cotton field at peak biomass coverage. Colors on the image represent differences in growth; however, these differences are enhanced when the normalized difference vegetation index (NDVI) is calculated (figure 5b). This new image can then be used to classify areas with different biomass amounts that may correspond to yield differences (figure 5c). Different vegetation characteristics and canopy attributes can be characterized based on the band combination used for the VI calculation. Some of the most common VIs that correlate with chlorophyll content, biomass, LAI, and plant water stress are described in table 2.
-
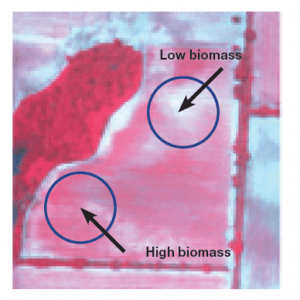
- Figure 5a. Satellite image of vegetation
-
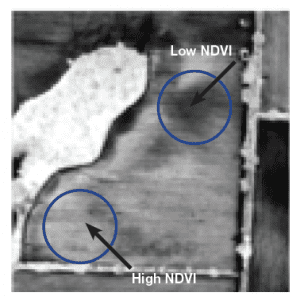
- Figure 5b. Vegetation index (NDVI) image differentiating biomass differences
-
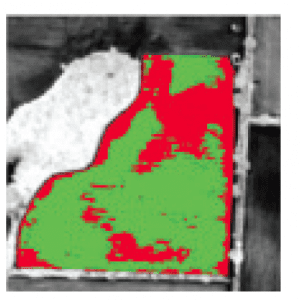
- Figure 5c. Low and high biomass classes based on the NDVI image
Vegetation Index Values
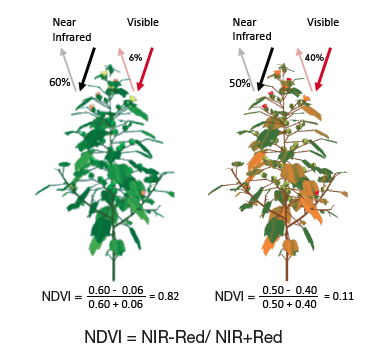
Figure 6. Differences in NDVI based on plant health status
VI values indicate differences in vegetation condition or amount. Those differences are expressed by changes in spectral reflectance at specific portions of the EM spectrum. For example, green vegetation (left plant, figure 6) absorbs most of the incident VIS light and reflects a large portion of the NIR light. In contrast, unhealthy or sparse vegetation (right plant, figure 6) reflects more VIS light and less NIR light. When the NDVI is used to assess vegetation characteristics (figure 6), low NDVI values can be related to chlorotic plants or low biomass, and high NDVI values could correspond with healthy plants or high biomass.
Table 2. Application examples of remote sensing in agriculture.
| Application | Why Use Remote Sensing | Spatial Resolution Required | Spectral Resolution Required | Temporal Resolution Required | Type of Remote Sensor | Vegetation Index Used | Benefits |
|---|---|---|---|---|---|---|---|
| Nitrogen management | Plant growth and nitrogen deficiency symptoms can be detected by leaf spectral reflectance differences in the Red and NIR portion of the EM spectrum | 1 m to 10 m* | VIS and NIR wavelengths | Weekly to monthly. Sensing minimum two times during the growing season | GreenSeeker or Crop Circle (Active sensors) or Rapideye images (passive sensor) | NDVI,GNDVI,CI590-CIred edge | Site-specific nitrogen application; minimize nitrogen loss |
| Irrigation | Heat emitted by plants under water stress can be assessed through thermal images. Spectral changes due to water stress can be also detected with VIS and NIR wavelengths | 1 m to 10 m* | VIS, NIR (700 -1300 nm) and Mid IR (1300 - 2500nm ) wavelengths | Daily to Weekly | Thermal IR cameras or any sensor collecting NIR or Mid IR wavelengths | WI, NDWI | Variable-rate irrigation; irrigation scheduling |
| Yield Prediction | Plant growth can be detected by plant spectral differences in the VIS and NIR portion of the EM spectrum | 1 m to 30 m* | VIS and NIR wavelengths | Sensing minimum two times during growing season | Passive or active sensors are suitable for growth assessment | NDVI, GNDVI, WDRVI | Site-specific management of irrigation, fertilization, plant growth regulators, or pests |
| Crop disease stress | Heat emitted by plants under stress can be detected by thermal images. Spectral changes due to disease stress can also be detected with VIS and NIR wavelengths | 1 m to 10 m* | VIS, NIR (700 -1300 nm) & Mid IR (1300 - 2500nm) wavelengths | Daily to Weekly | Passive or active sensors are suitable; however, active sensors allow shorter collection intervals. | ARI, TCARI | Early assessment supports decisions on when, where, and how to apply fungicides. |
| Soil mapping | Variations in soil color related to soil properties such as texture, or organic matter can be detected by soil spectral differences in the Red and NIR portion of the EM spectrum | 1 m to 30 m* | VIS and NIR wavelengths | Weekly to Monthly | Passive or active sensors. | SAVI, MSAVI | Directed soil sampling; variable rate application of nutrients |