Forestry
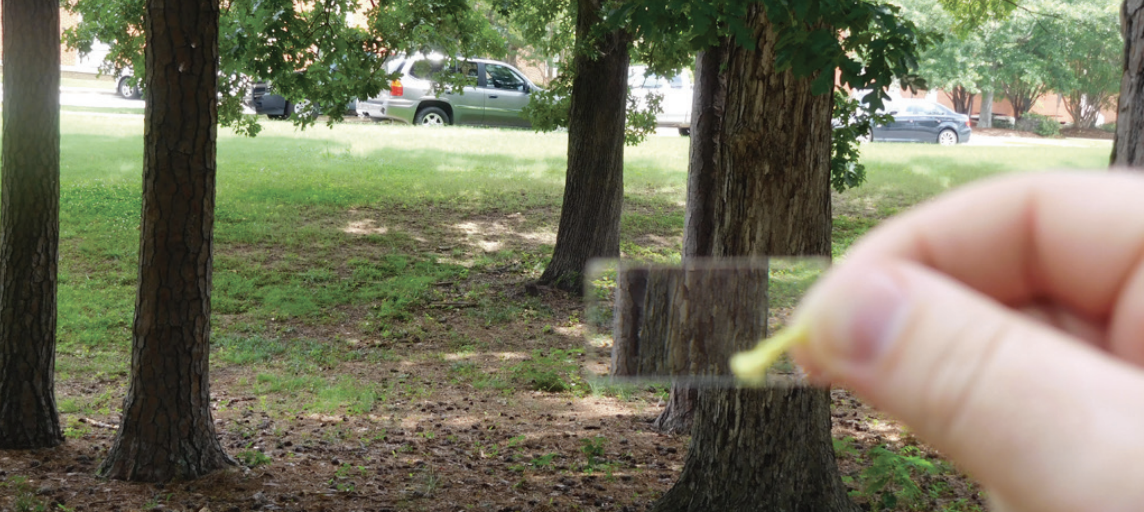
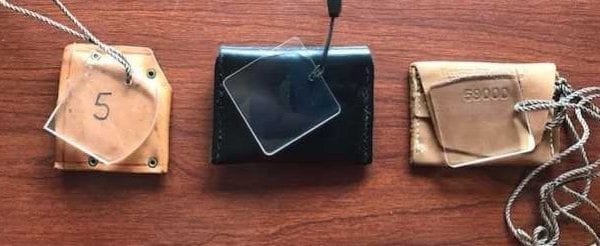
Figure 1. Example of three different prism configurations (BAF 5, 10, and 20, respectively). Prisms come in many BAFs, shapes, and sizes, so pay attention to the prism purchased and be sure that the prism matches the intended use.
For an accurate and cost-effective assessment, a forest inventory method should match the conditions of the forest stand. Variable-radius plot sampling is commonly used in the southeastern United States because it is viewed as quick and easy. It is best suited to inventories when volume estimates are a priority.
Variable-radius plots (VRPs), also referred to as point sampling or prism cruising, rely on the relationship between the diameter at breast height (DBH) of observed trees and the distance between those trees and an observer who stands at plot center. Like fixed-radius plots, VRPs are often distributed across a forest along a grid and established from a predetermined plot center. Then, using a wedge prism (figure 1) held directly over plot center, the observer rotates in a full circle, identifying and tallying trees “in” trees (figure 2). When using a wedge prism, “in” trees are those whose refracted section still overlaps the nonrefracted portion of the main bole, or stem (figure 3). “Out” trees do not overlap, while borderline trees are those that appear to have the offset portion that is visible in the prism aligned with or barely touching the edge of the main bole of the tree.
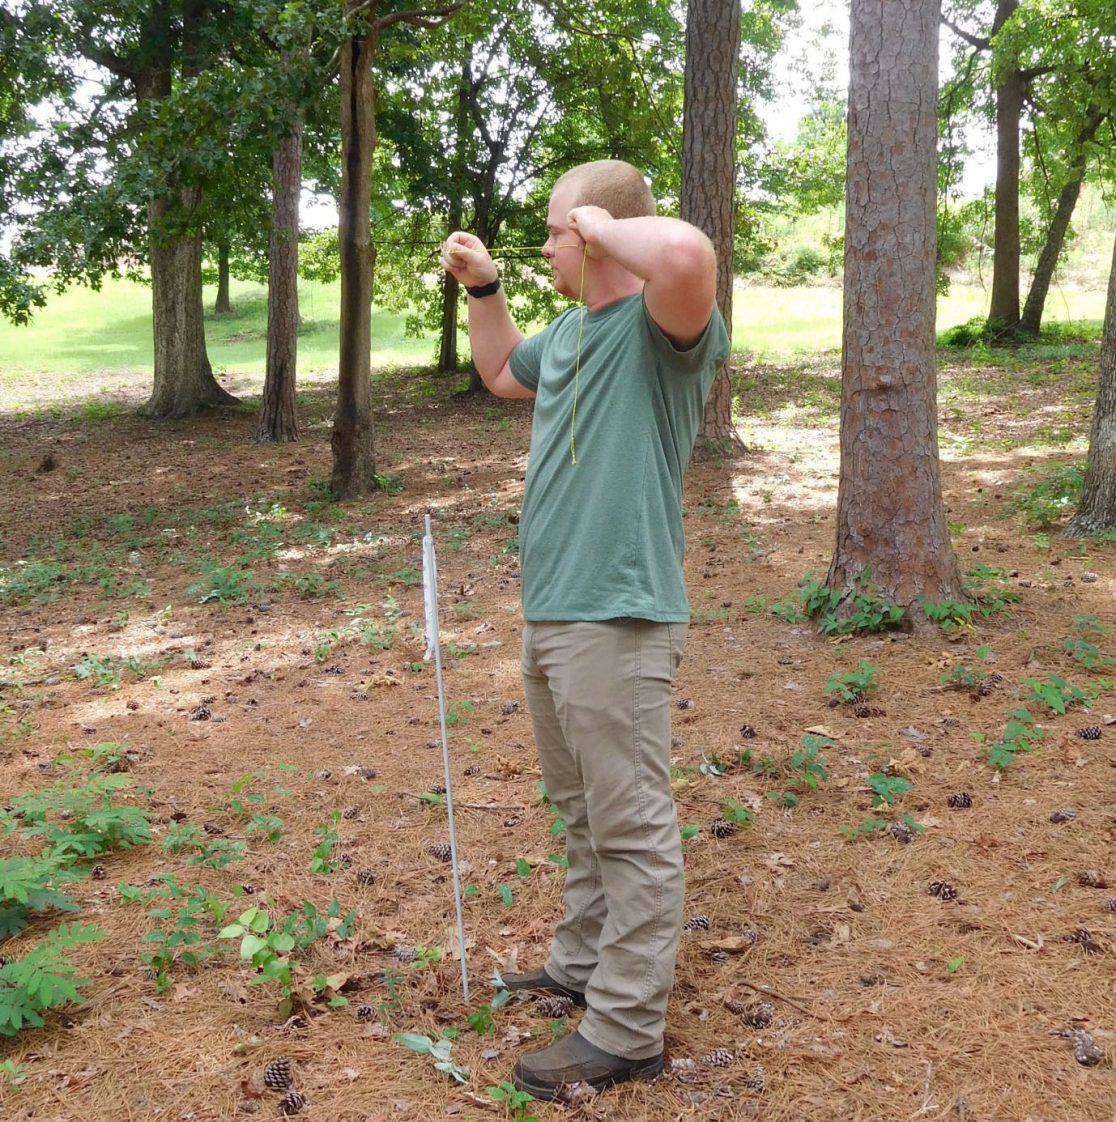
Figure 2. This image demonstrates the proper use of a prism. The prism is held a fixed distance from the observer’s eye, and directly over plot center. The observer then rotates 360 degrees to tally all trees. The observer should rotate around the prism, which rotates directly over plot center.
Once all in trees are tallied, the results are multiplied by the basal area factor (BAF) of the prism to determine the basal area represented by this sample point. DBH, height, and other tree measurements can be taken in the same manner used for fixed-radius plots.
Basal Area and Basal Area Factor (BAF)
Basal area can refer to the cross section of area that a single tree stem or all trees on an area occupy at a height of 4.5 feet. (breast height). This metric is used to represent the on-the-ground space that one stem is being utilized within a stand. From here, many trees can be summed to calculate basal area within space that one stem covers within a stand. This is typically done on a square feet/acre basis. At this point, basal area can be used with other measurements to provide an index of stand condition.
In many cases, basal area is determined methodically from the diameter at breast height (DBH) of trees measured within a plot. DBH refers to the diameter of a tree, outside of the bark, at a height of 4.5 feet from ground level. It is important to remember that DBH should always be measured on the uphill side of the tree.
Basal area factor (BAF) is a multiplication guide associated with the level of refraction in wedge prisms. By multiplying the number of trees counted in a tally by the BAF, an estimate of basal area is generated; 5, 10, and 20 BAF prisms are most commonly used in the Southeast.
Example:

Figure 3. Schematic of potential observations possible when using a wedge prism. Overlapping sections count as “in” and are included in the tally. Borderline trees should be determined based on their distance from plot center. If the distance is less than the critical distance, then the tree is “in.” Trees determined to be “out” are not counted in the tally.
13 trees tallied with a BAF 10 prism
13 trees * 10 = 130 feet2/acre of basal area
Benefits of Variable-Radius Plots
Variable-radius plots can be completed quickly by one person (table 1). This inventory method provides landowners and land managers with a useful summary of stand stocking in terms of basal area. It is especially well suited to bottomland hardwood forests and other areas where tree diameters are large and understory vegetation is limited. When volume calculations alone are of interest, VRPs may also be used successfully.
Drawbacks of Variable-Radius Plots
Variable-radius plots have several limiting factors that must be considered (table 1). Dense stands, vegetation on trees, and understory brush can make trees hard to see and sampling difficult. Additionally, because tree diameters influence what trees are counted, those trees with large diameters may be some distance away but still in the plot, making them easy to miss.
Other problems arise when borderline trees are encountered (figure 5). Again, borderline trees are those that cannot be classified as in or out of the plot based on visual observations with a prism. Proper determination of borderline trees involves measuring both the diameter of the borderline tree and observer distance from that tree. The diameter is then multiplied by the plot radius factor that corresponds with the BAF of the prism used (table 2). This product is referred to as the limiting distance. If the distance from the midpoint of the tree’s bole to the observer is less than or equal to the limiting distance, it is considered to be in and included in the plot; otherwise, it is not tallied.
Table 1. Variable-Radius Plots and Overview of Strengths and Weaknesses
| Description | Common Tools Needed | Strengths | Drawbacks |
|---|---|---|---|
| Relies on random or systematically developed plot centers. Trees tallied are based on the relationship between the diameter at breast height and the distance those trees are from plot center. |
|
|
|
Table 2. Examples of Plot Radius Factors (PRFs) Associated With a 9" Tree
| BAF | PRF | Example with 9" tree |
|---|---|---|
| 5 | 3.89 | 9" * 3.98 = 35.01' |
| 10 | 2.75 | 9" * 2.75 - 24.75' |
| 20 | 1.94 | 9” * 1.94 = 17.46’ |

Figure 4. Example of “in” tree through a prism. The refracted portion of the tree overlaps with the rest of the stem. This tree is included in the tally.
Due to the increased complexity and time it takes to calculate limiting distance, sampling borderline trees can be subjected to a variety of shortcuts. These include counting every borderline tree, ignoring them, or counting every other borderline tree for that tally. These shortcut methods are not recommended as they may produce higher error rates and can negate the timesaving benefits of using variable-radius plots by increasing sampling error.
As mentioned earlier, the initial tally of a VRP only provides an estimate of the basal area for that plot. Though often used to make management decisions because of their simplicity, basal area estimates alone provide relatively little information about stand condition. For instance, a loblolly pine stand with a basal area of 60 ft2/acre and an average DBH of 6 inches would be the equivalent of about 300 trees per acre. Compare these conditions to a stand that also has 60 feet2/acre, but with an average DBH of 14 inches. This stand would be much more open with fewer trees per acre (about 55 trees per acre). Basal area alone cannot provide this information on stand condition.
Although basal area can be determined based on the prism-based tally alone, the determination of in and out trees is only the beginning of adequately assessing a forest. Once in trees are determined, height and diameter information should also be recorded for all in trees. Additional tree and stand information, such as DBH and TPA, are needed to make informed decisions and require more complicated equations to estimate using variable radius plots than with fixed-radius plots.
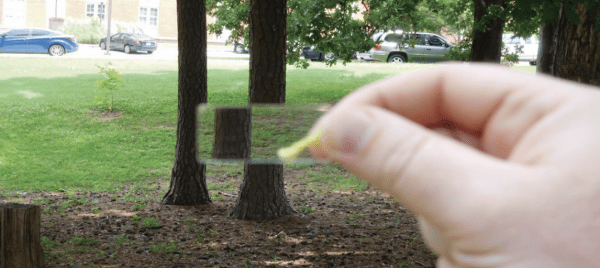
Figure 5. Example of a borderline tree through a prism. Notice that the refracted portion aligns with, but does not overlap the nonrefracted portion of the stem. In this case, the tree’s diameter and distance from plot center should be measured. The diameter is multiplied by the plot radius factor (PRF) and compared to the measured distance from plot center to determine if it is in or out.
Finally, variable-radius plots have a higher probability of favoring the sampling of larger trees. The resulting plots may severely over- or underestimate the composition of the stand based on tree diameter, spacing, and distance from the observer.
Base Sampling Methods on Objectives
A study comparing fixed- and variable-radius plots in Georgia found that for board-foot volume estimates, variable radius plots using a BAF-10 wedge prism resulted in error rates greater than 12 percent in second-growth loblolly pine stands. This was higher than in fixed-radius plots completed on the same stand, suggesting that increased error rates are potentially a drawback to VRPs.
Alternatively, the same study also examined uneven-aged bottomland hardwood stands in Georgia and found that BAF-10 cruises were the most efficient measurement technique. Though error rates were slightly higher than those associated with 1/5 and 1/10th acre fixed-radius plots, they were not significant. Additionally, BAF-10 plots were nearly 2.5 minutes faster than 1/10th acre plots. When spread across a day of sampling, that time adds up quickly. However, using VRPs to quantify metrics such as trees per acre or measuring borderline trees can actually increase the time spent at one plot, potentially negating such benefits. This is a drawback to variable-radius plots, not fixed.

Figure 6. Example of an “out” tree through a prism. Here, the refracted portion of the stem is clearly offset from the rest of the tree. Specifically notice that space can be seen between the refraction and main stem. This tree is out and would not be included in the tally.
Ultimately, the choice of sampling method should be a product of the stand and the measurements needed to assess stand condition. For example, VRPs are often thought of as a more robust sampling and cost-efficient (faster) scheme for determining volume and stand conditions than fixed-radius plots within uneven-aged forest systems, due to the importance placed on large stems. Because larger trees can represent a larger proportion of the product volume within a stand, these trees are more likely to be included in plots even at longer distances from plot center. Those who are interested in diameter distribution or specific product class volumes may lean toward the unbiased approach offered by fixed-radius plots.
By understanding the nuances associated with each sampling technique, managers and landowners have the ability to select the most appropriate sampling scheme for each individual stand. This saves time and money up front by ensuring that samples are correctly measured the first time, resulting in increased profits and appropriate land management decisions.
Calculating Limiting Distance
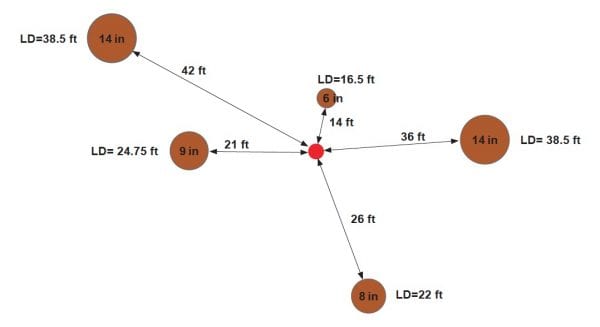
Figure 7. Example of limiting distances associated with trees of varying diameters and their position relative to plot center (red dot) when variable-radius plots are used.
Assume you are about to start measuring the final variable-radius plot for an inventory when you realize that you have lost your 10 BAF prism. What do you do? You can use the process for calculating limiting distance. Begin by establishing the plot center. Using a tape, measure the distance from plot center to the center of the nearest tree to the right of north. Then, measure the DBH of that tree and multiply it by 2.75 (PRF for BAF-10 prisms) to calculate the limiting distance.
If the number you get from multiplying DBH by 2.75 is greater than the distance you measured from plot center, then the tree would be counted as in your plot, and the equivalent of 10 feet2 of basal area. If the limiting distance is less than the distance you measured from plot center to the tree, then the tree is out and not counted in the tally.
Continue around plot center until all necessary trees are measured. See an example of this process is figure 7.
Calculating Limiting Distance
| Tree diameter (inches) | Distance from plot center to tree center (feet) | Limiting distance (LD) calculation (fee) | In/Out | Basal Area (square feet) |
|---|---|---|---|---|
| 6 | 14 | 6 * 2.75 = 16.50 | In | 10 feet2 |
| 14 | 36 | 14 * 2.75 = 38.50 | In | 10 feet2 |
| 8 | 26 | 8 * 2.75 = 22.00 | Out | -- |
| 9 | 21 | 9 * 2.75 = 24.75 | In | 10 feet2 |
| 14 | 42 | 14 * 2.75 = 38.50 | Out | -- |
| Total on plot | 30 feet2 |
Kent A. Keene, Graduate Research, and Becky Barlow, Extension Specialist, Associate Professor, both in the School of Forestry and Wildlife Science, Auburn University
Reviewed May 2025, Benefits & Drawbacks to Variable-Radius Plots, FOR-2062