Farm Management
Nitrogen (N) losses from crop production systems have both economic and environmental implications. Each year growers spend a significant amount of money on nitrogen-based fertilizers.
Not all the fertilizer, however, ends up in the plants. Many researchers have reported that only about half of the applied nitrogen fertilizer was utilized by growing crops. The rest was potentially lost to the environment. Environmental N loss (ENL) can occur via several pathways, including leaching, runoff, volatilization, and denitrification, and vary among farms and crops due to the influence of soil, weather, and, most importantly, management practices. Quantification of individual N loss pathways is complex and involves time, additional equipment, and labor. However, one of the cost- effective and feasible ways of measuring ENL is using nitrogen budget based on N inputs and outputs. Just like a yearly income balance sheet helps gauge profit and loss of an enterprise, a nitrogen budget can help farmers understand how much nitrogen was lost during a growing season and if there is a need to revisit or adjust the management practices relating to nitrogen application rate, timing, or source.
What Is a Nitrogen Budget?
Nitrogen budget is defined as a record of N inputs, outputs, and retention in the soil at a field scale. Nitrogen budget is based on the concept of mass balance where sum of all N inputs equal the sum of all N outputs. Nitrogen budget helps in better understanding of the nitrogen cycling and measures farm sustainability, profitability, and environmental safety.
What Are the Components of a N Budget?
There are two major components of nitrogen budget: N inputs and N outputs (table 1). Nitrogen input into an farm system can occur via fertilizer or manure addition, crop seed, irrigation, deposition from atmosphere, and N fixation (symbiotic and nonsymbiotic) while N output from a farm system can occur either through harvested crops or various losses associated with N.
For a reliable N budget, it is critical to accurately measure these components. Some components, such as manure N contribution, symbiotic, and nonsymbiotic N fixation, are relatively difficult to estimate under field conditions. In such cases, reference can be made to published literature values under similar conditions.
Table 1: Components of Nitrogen Budget
| Nitrogen Inputs | Nitrogen Outputs |
|---|---|
| Fertilizer N | Crop N removal: Grain N removal |
| Manure N | Crop N removal: Biomass N removal |
| Crop Seed N | Environmental N loss: Leaching |
| Irrigation Water N | Environmental N loss: Denitrification |
| Atmospheric N Deposition (wet) | Environmental N loss: Volatilization |
| Environmental N loss: Runoff | |
| ΣInputs | ΣOutputs |
Estimation of Nitrogen Inputs
Fertilizer N: The N input (lb/acre) from fertilizer can be calculated from the amount of fertilizer applied as
amount of fertilizer applied (lb/acre) × fertilizer N content (%)
100
The value obtained in lb/acre can be converted into kg/ ha by multiplying with 1.12 (conversion factor). Some of the commonly used N fertilizers by farmers and their N content (%) are presented in table 2.
Table 2: Nitrogen Content of Commonly Used Nitrogen Fertilizers
| Fertilizer | N content (%) |
|---|---|
| Anhydrous ammonia | 82 |
| Ammonium nitrate | 34 |
| Urea | 46 |
| Urea-ammonium nitrate (UAN) | 28 |
| Ammonium sulphate | 21 |
| Ammonium chloride | 25 |
Example 1: Consider that a farmer applies urea at a rate of 300 lb/acre before planting. The N contribution can be calculated using above the formula as follows:
300 × 46 divided by 100 = 138 lb N/acre
Manure N: Contrary to synthetic fertilizers, total manure N includes both organically bound N and inorganic N (NO3- and NH4+). Unlike inorganic N, which is readily plant available, organic N must undergo an additional step of mineralization before it can be utilized by plants.
Mineralization is defined as microbial conversion of organic N into inorganic N and provides information on the N release amount and pattern from organic amendments, such as manure, over time. The mineralization rate can be highly variable and difficult to measure due to the effect of manure C:N ratio and soil conditions, such as moisture, temperature, microbial activity, etc. In general, about 50% of the total manure N becomes plant available during first year of application. This assumption, however, may not hold true for all farm conditions. Different studies have reported varied mineralization rates (table 3).
Table 3: Mineralization Rates of Poultry Litter Reported by Previous Studies
*Pitta, C.S.R., P.F. Adami, A. Pelissari, T.S. Assmann, M.F. Franchin, et al. 2012. Year-round poultry litter decomposition and N, P, K and Ca release. Rev. Bras. Ciência do Solo 36:1043–1053.
**Gordillo, R.M., and M.L. Cabrera. 1997. Waste management. mineralizable nitrogen in broiler litter of. effect of selected litter chemical characteristics. J. Environ. Qual., 26:1672–1679
***Bitzer, C.C., and J.T. Sims. 1988. Estimating the availability of nitrogen in broiler litter through laboratory and field studies. J. Environ. Qual. 17:47–54.
****Evers, G.W. 1999. Comparison of broiler poultry litter and commercial fertilizer for coastal bermudagrass production in the south-eastern U.S. Journal of sustainable agriculture, 12:55–57.
| Mineralization rate (%) |
|---|
| 85* |
| 90** |
| 67*** |
| 60**** |
The N input from manure (lb/acre) can be calculated from the amount of manure applied as follows:
manure applied (lb/acre) × mineralization rate(%) × N content (%)
10,000
For convenience, manure applied in tons/acre can be converted into lb/acre by multiplying by 2,000 (conversion factor).
For manure N determination, collect representative manure samples before application and ship to the Extension soil testing laboratory at Auburn University or a commercial laboratory. In the analysis report, the nutrient values are generally reported on both dry and wet bases (figure 1). The N content on a sampled wet basis (%) should be used for calculating N contribution unless significant drying of the manure occurs before field application. The lab report will also provide fertilizer N value in lb/ton. However, this value refers to the total N present in litter. The actual available N is much lower than the total N and depends on the mineralization rate of manure.
Example 2: Suppose a farmer applied poultry litter six months before planting at a rate of 2 tons/acre, i.e. 2 × 2,000 = 4,000 lb/acre. The litter N content reported on as sampled (wet basis) was 2.56% (figure 1). Assuming 60% mineralization rate (table 3), N contribution can be calculated as follows:
4000 × 60 ×2.56 divided by 10,000 = 61.44 lb N/acre
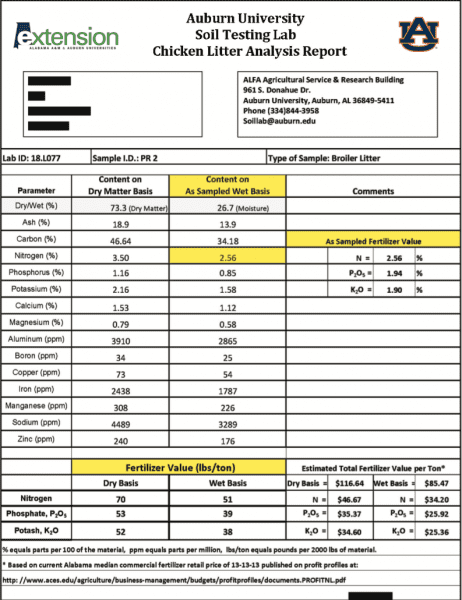
Figure 1. Chicken Litter Analysis Report from Auburn University Soil Testing Lab.
Crop Seed N: The crop seed used during planting may also contribute N. However, this contribution is relatively less significant and can be calculated (lb/acre) as follows:
seeding rate (lb/acre) × N concentration (%)
100
For seed N concentration, a representative sample from the seed bag should be collected and shipped to a nearby land grant Extension lab or private lab for analysis.
Example 3: Consider farmer-planted corn at a seed rate of 25 lb per acre with seed N concentration of 1.50%. The N contributed by crop seed can be calculated as follows:
25 × 1.50 divided by 100 = 3.75 lb N/acre
Irrigation Water N: The N input (lb/acre) supplied through irrigation water can be calculated as follows:
Total irrigation applied (acre-in) × N03-N content (mg/L) × 0.253 × 0.89 where 0.253 and 0.89 are conversion factors.
To test irrigation water for N03-N content, collect 4 to 5 samples (about 20 to 25 ml each) during the growing period in clean, plastic bottles and ship as early as possible to a nearby water testing lab. The lab usually reports N03-N content in mg/L.
Example 4: If a field is applied with total irrigation of 10 acre-in during the growing season and an average N content of irrigating water is 10 mg/L, then N contributed can be calculated as follows:
10 × 10 × 0.253 × 0.89 = 22.5lbN/acre
Atmospheric N Deposition (Wet): Data on wet atmospheric N deposition can be collected from National Trends Network (NTN) of the National Atmospheric Deposition Program (NADP), which measures ammonium (NH4+) and nitrate (NO3-) N content in one- week rain samples. In Alabama, there are two active NTN sites (table 4). To access data, visit http://nadp.slh. wisc.edu/ntn/.
Information on total rainfall (inches) received during the growing period can be obtained from the Auburn University Mesonet (http://awis.aumesonet.com/). At present, 12 different Mesonet weather stations are operating in the state. While considering the NTN site and the Mesonet weather station, proximity from the farm should be a key factor.
This N input (lb/acre) can be calculated as follows:
Total rainfall received (in.) × N content (mg/L) × 0.253 × 0.89
where 0.253 and 0.89 are conversion factors.
Example 5: If a farm received a total rainfall of 23 inches during the growing season with an average N content of 4 mg/L, then N contributed can be calculated as follows:
23 × 4 × 0.253 × 0.89 = 20.71 lb N/acre
Table 4: Active National Trends Network (NTN) Sites in Alabama
| Site ID | Site Name | County |
|---|---|---|
| AL10 | Black Belt Research & Extension Center | Dallas |
| AL99 | Sand Mountain Research & Extension Center | DeKalb |
Estimation of N Outputs
Crop N removal: Depending on crop type, N can either be removed by grains or by other crop biomass harvested (stems, leaves).
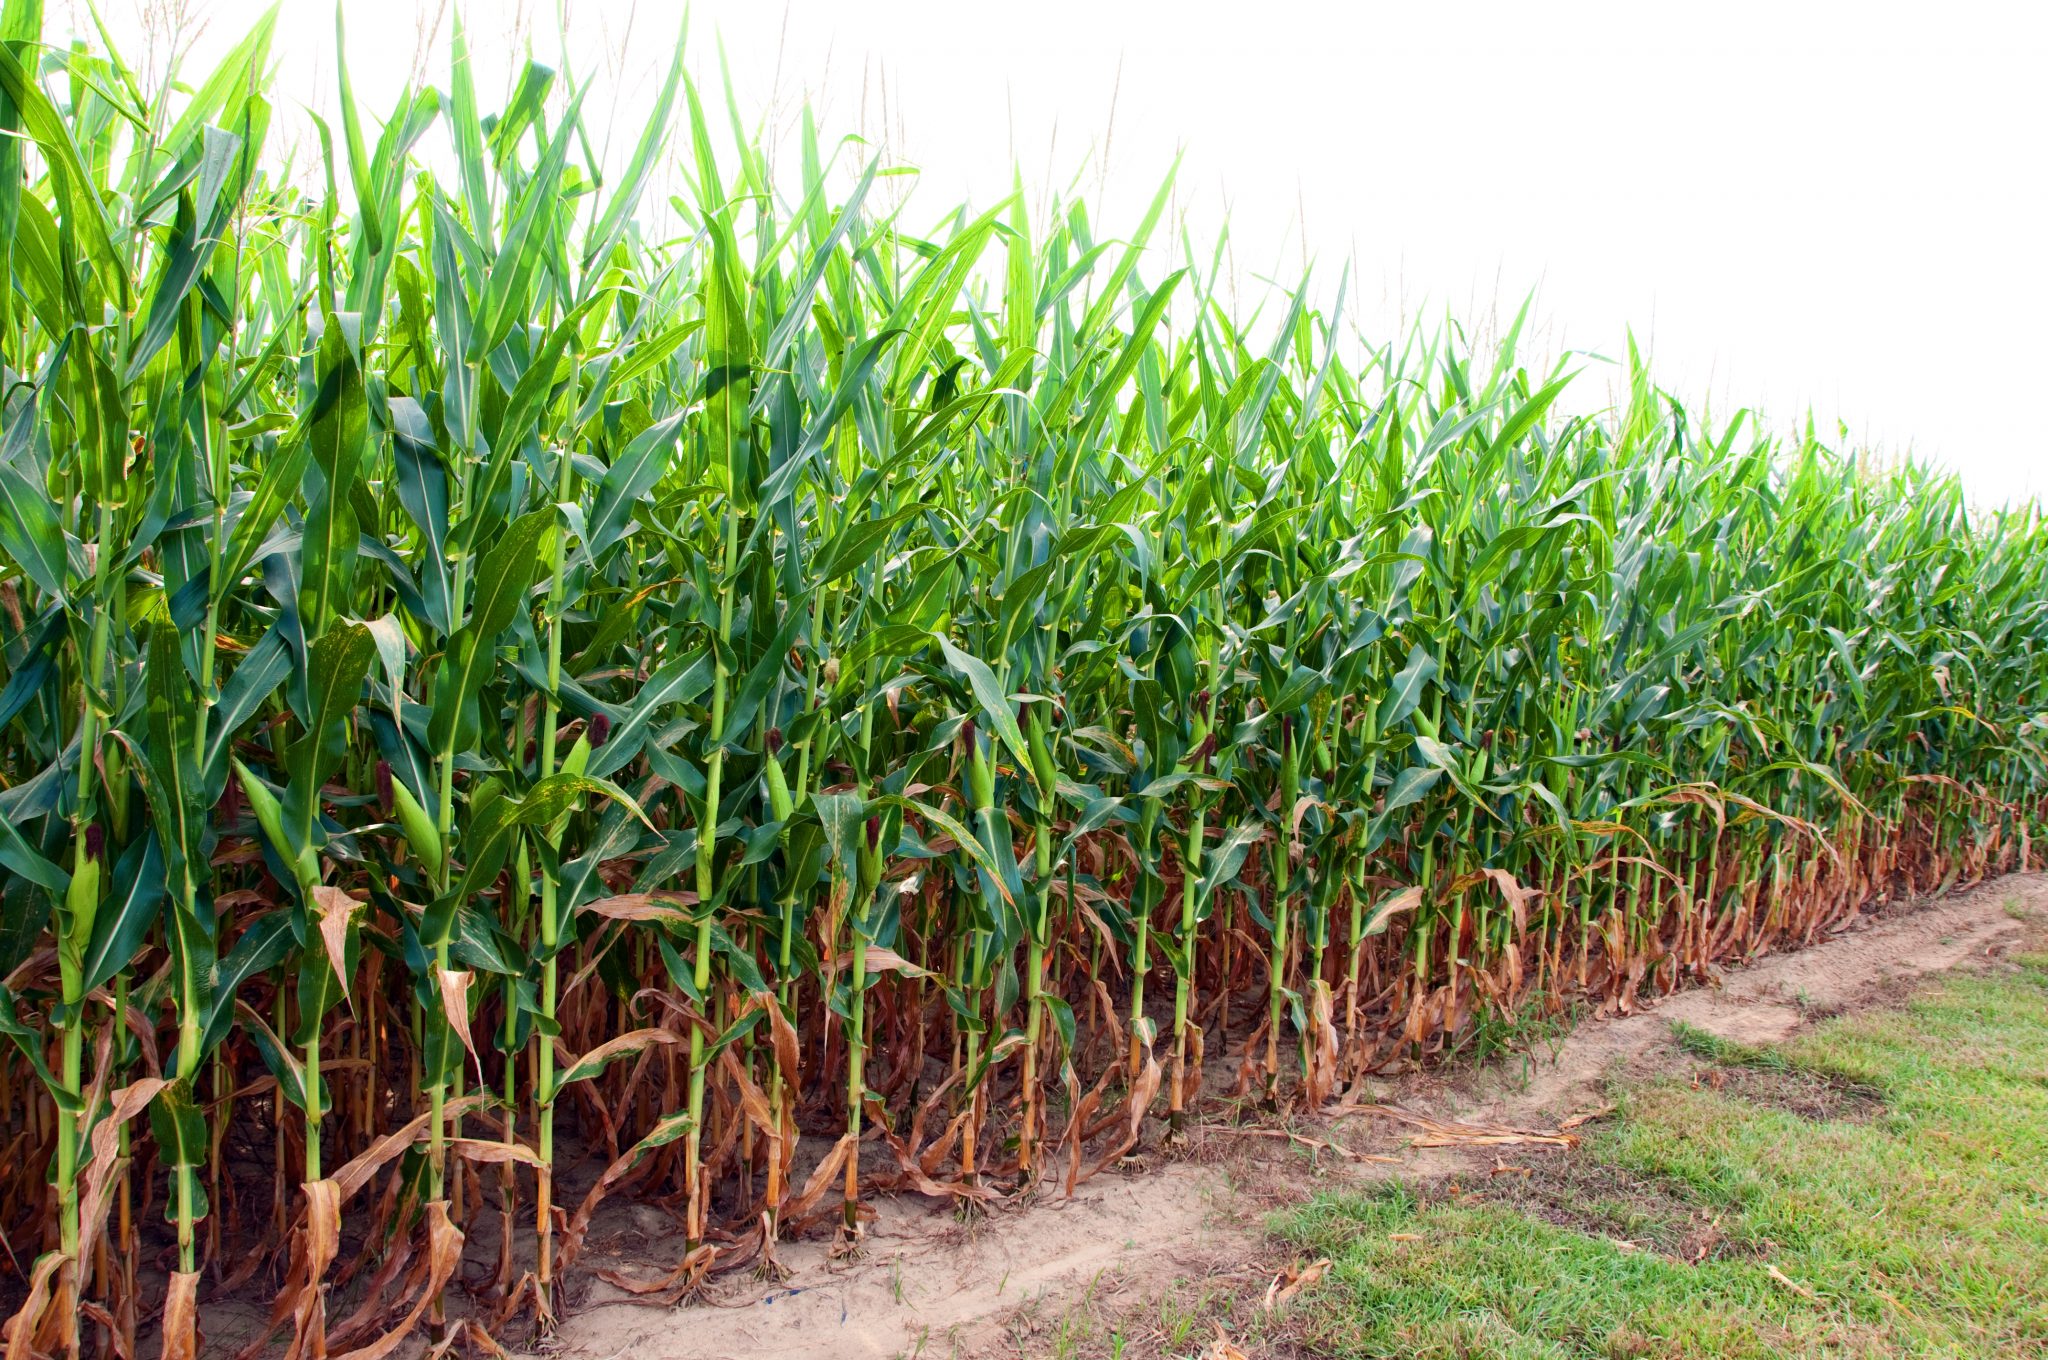
Grain N removal: In cereals such as corn, only grains get removed while leaves and stems are left behind in the field after harvesting (figure 2). Grain N removal (lb/acre) can be calculated as follows:
yield (lb/acre) × grain N content (%)
100
A representative grain sample should be tested for N content. In general, corn yields reported in bushels/acre are standardized to 56 pounds per bushel and 15.5% moisture. Hence, yield in bushels/acre can be converted to lb/acre by multiplying with 56 (conversion factor).
Example 6: If a farm yielded 190 bushels/acre, i.e. between 190 and 56 = 10,640 lb/acre with grain N content of 1.50%, then grain N removal is calculated as follows:
10,640 × 1.50 divided by 100 = 159.6 lb N/acre
Biomass N removal: For crop biomass N removal, harvested crop biomass (leaves, stems or both) and its N content should be known. For accurate crop biomass data (figure 2), refer to the sampling procedure mentioned in UF/IFAS Extension document SL401 (https://edis.ifas.ufl.edu/ss614). A representative subsample of the harvested crop biomass should be sent to a nearby land grant Extension lab or private lab for N content (%) analysis. The N left behind in the field after crop harvest in the form of residues can also be calculated by multiplying residue biomass left behind with its N content.
crop biomass harvested (lb/acre) × tissue N concentration (%)
100
-
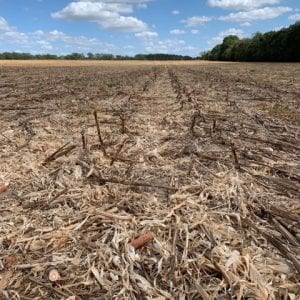
- Figure 2. Corn residue left in the field after harvesting.
-
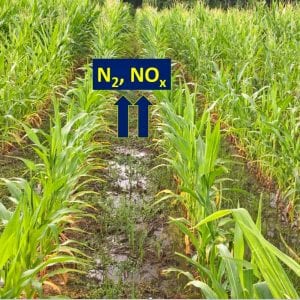
- Figure 3. Denitrification loss of nitrogen (as N or NOx) under standing water or flooded conditions.
Environmental N Loss (ENL): Nitrogen is lost from the field via several pathways:
Leaching is the loss of nitrate nitrogen (NO3-N) with the downward movement of water through the soil profile. It is predominant in sandy soils such as the Coastal Plain soils of Alabama.
Denitrification is the loss of nitrate nitrogen to the atmosphere in the form of various NxO gases (figure 3). Denitrification is favored when water stagnates on the soil surface and dominates in heavy, clay-rich soils, such as the Blackland Prairie soils of Alabama, due to poor drainage.
Volatilization is the loss of ammonium nitrogen (NH4-N) to the atmosphere in the form of ammonia gas (NH3). Volatilization is common under high pH soils and surface application of fertilizer or manure.
Runoff is the loss of nitrate nitrogen (NO3-N) with the surface runoff of water.
Environmental N loss is harmful in many ways:
- High N levels (>10 mg/L) in drinking water due to leaching adversely affects pregnant women and infants.
- NxO gases released into the atmosphere due to denitrification are potential greenhouse gases contributing to global warming.
- Nitrous oxide (N2O) in the atmosphere is the precursor of nitric acid (HNO3) resulting in acid rain.
- N enrichment of water bodies due to surface runoff causes algal bloom.
Nitrogen budget can be used as follows to estimate ENL:
ΣInputs = ΣOutputs
ΣInputs = Crop N removal + Environmental N loss
Environmental N loss = ΣInputs – Crop N removal
Example 7
*values reported (lb/acre) are from previous examples
| N Inputs | N Inputs Value (lb/ac) | N Outputs | N Outputs Value (lb/ac) |
|---|---|---|---|
| Fertilizer N | 138 | Grain N removal | 159.6 |
| Manure N | 61.44 | Environmental N Loss (ENL) | |
| Crop Seed N | 0.375 | ||
| Irrigation Water N | 22.5 | ||
| Atmospheric N Deposition | 20.71 | ||
| ΣInputs | 243.02 | ΣOutputs | 159.6+ ENL |
ΣInputs = ΣOutputs
ΣInputs = Grain N removal + Environmental N loss
Environmental N loss = ΣInputs – Grain N removal
ENL = 243.02 – 159.6 = 83.42 lb/ac
Interpretation
A higher positive value of ENL indicates greater N loss from the field. In example 7, 83.42 pounds N/acre was lost to the environment, which was about 34% of the total N input. However, in many situations, the ENL may range between 50% and 70% of total N input.
Farmers should develop a nitrogen budget to evaluate their nitrogen management practices. By quantifying both N inputs and outputs, a nitrogen budget assists growers in recognizing surplus N in their fields. Optimum use of N fertilizer reduces both N losses as well as input costs giving economic benefits to farmers. The influence of changed agronomic practices on N losses and nitrogen-use efficiency (NUE) can also be predicted using N budget. Nitrogen-use efficiency (%) is the amount of N taken by the plants compared to the amount of N applied. Low NUE may lead to greater ENL. Therefore, N budget can be a valuable tool to evaluate a farm’s nitrogen management.
Download a PDF of Using a Nitrogen Budget in Farm Management, ANR-2594.