
Farm Management

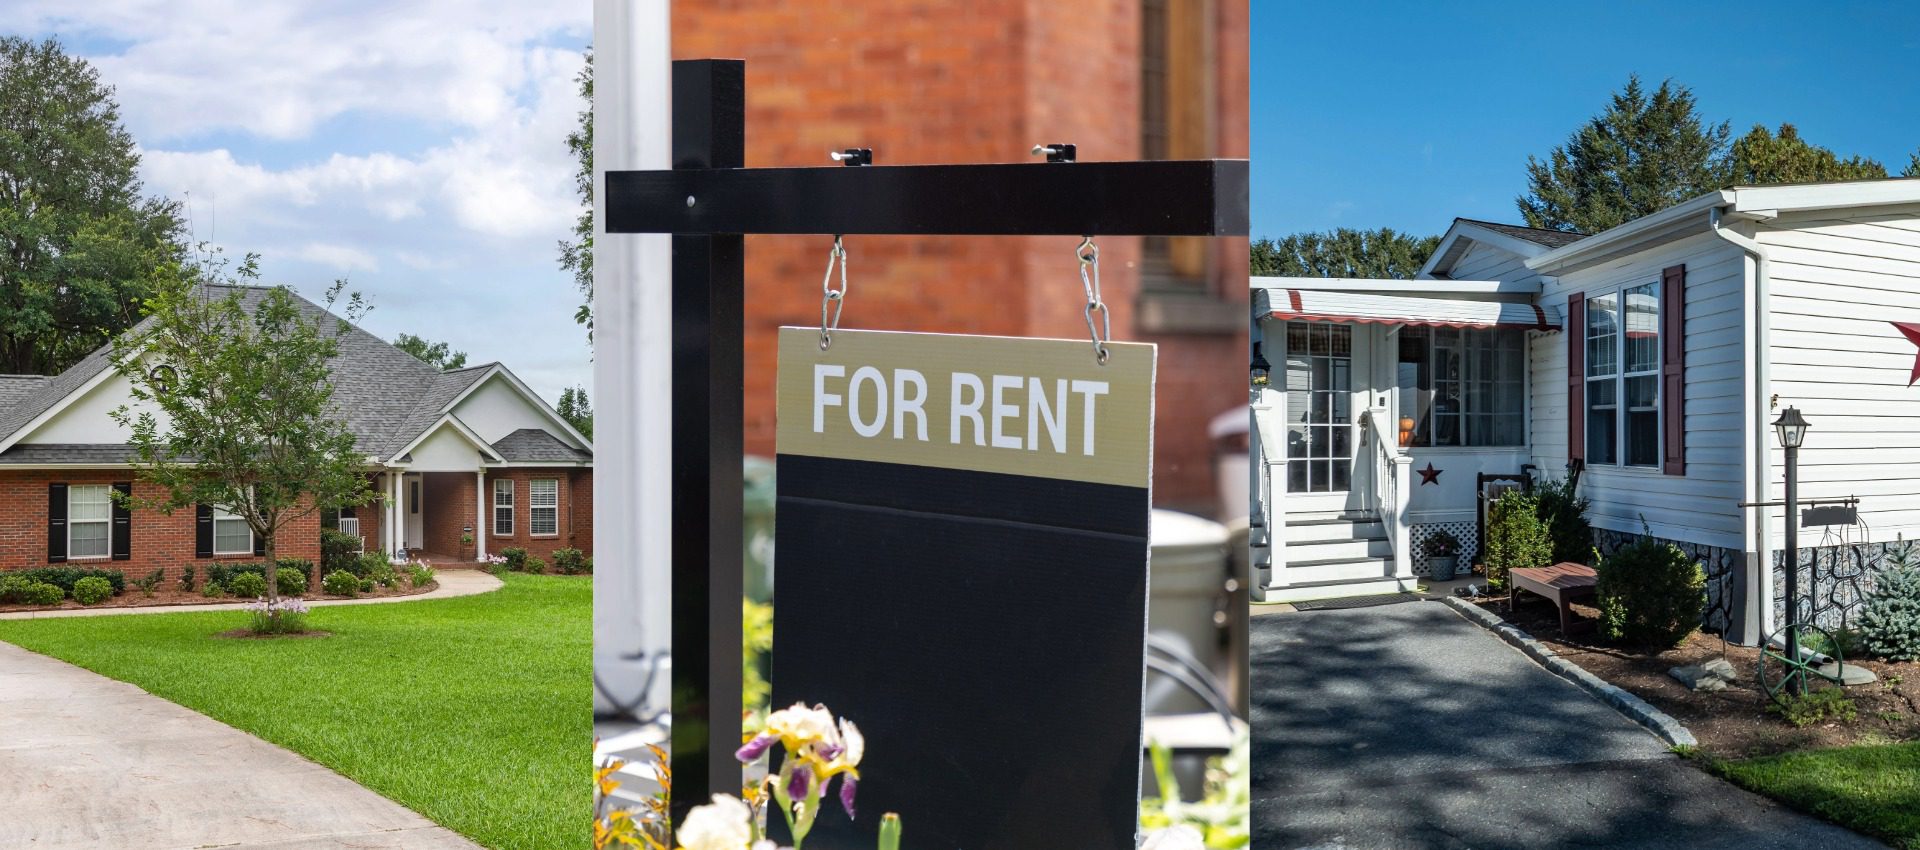
Drawing on data from the American Community Survey, this publication summarizes recent housing trends in Alabama, with particular attention to the differences between rural and urban areas. It focuses on vacancy rates, owner-occupancy, structure type, and affordability, as these are key metrics for community well-being. These data are informative for communities and decision-makers regarding future planning and well-being initiatives.
Vacancy Rates
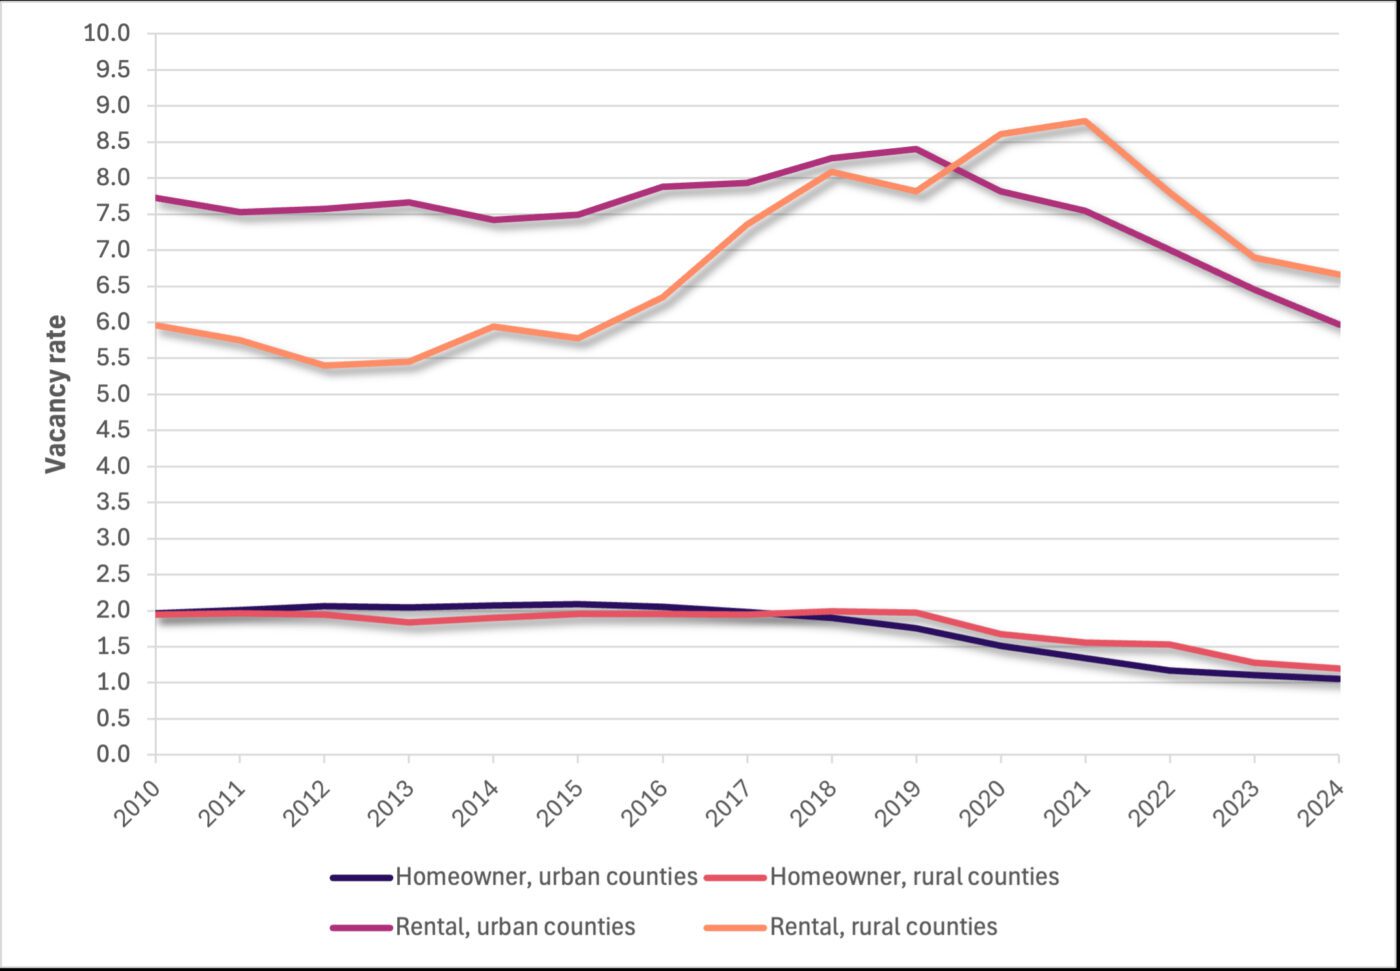
Figure 1. Homeowner and rental vacancy rates, 2010–2024. (Source: American Community Survey)
The vacancy rate measures the percentage of housing units available for rent or sale and is helpful for determining the housing supply for renters and buyers. Higher rental vacancy rates can indicate lower rents and, therefore, a better market for renters, as there are more rental units available to meet demand. Similarly, for home buyers, higher vacancy rates indicate more homes available for purchase and a more favorable housing market for buyers rather than sellers.
From 2010 to 2018, the homeowner vacancy rates in Alabama were relatively stable at about 2%, yet since 2018, these rates have declined, and in 2024 homeowner vacancy rates reached 1%. These changes in Alabama’s overall homeowner vacancy rates align with ongoing changes in other states in the region. Notably, there are no significant differences between urban and rural Alabama counties in homeowner vacancy rates.
Compared to the homeowner vacancy rates, the rental vacancy rates are higher in both urban and rural counties. However, while there is a difference, higher rental vacancy rates than homeowner vacancy rates are normal within the housing market.
Vacancy rates are more notably divided by the type of resident, renter or homeowner, while the geographic location, urban or rural, is less pronounced (figure 1). In some areas of the state, there are both lower homeowner vacancies and lower rental vacancies, and while there is variation by county, this statewide trend of low homeowner vacancies and low rental vacancies point to a heightened need for increased housing supply (figures 2 and 3). Historically, rural counties had lower rental vacancy rates prior to 2020 and are experiencing higher rental vacancy rates presently. This indicates that there is a greater rental housing supply available in rural counties.
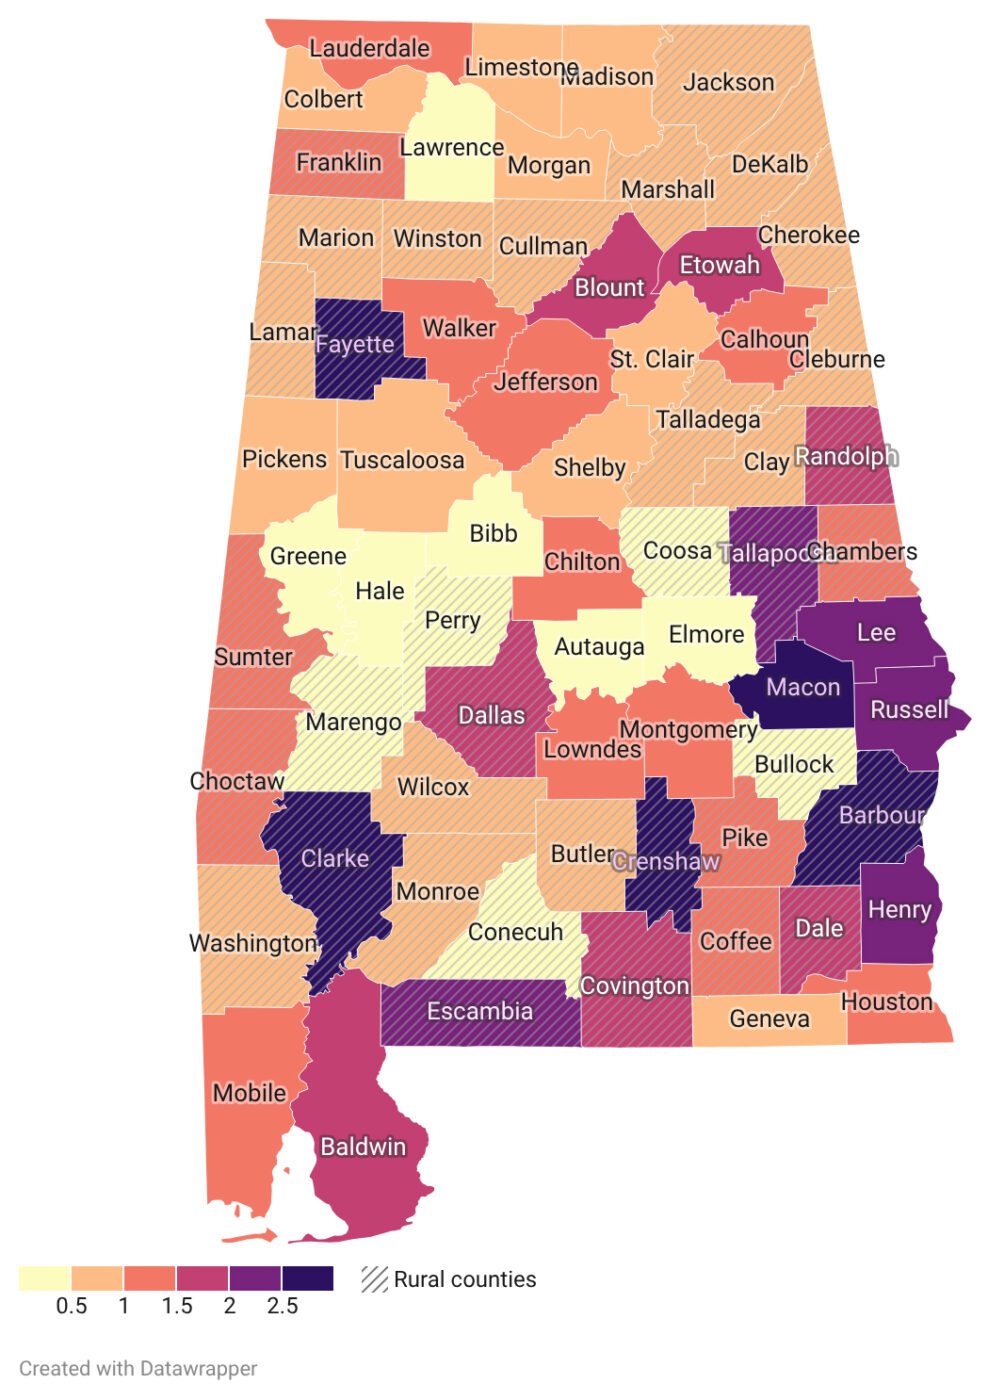
Figure 2. Homeowner vacancy rates, 2024 (Source: American Community Survey)
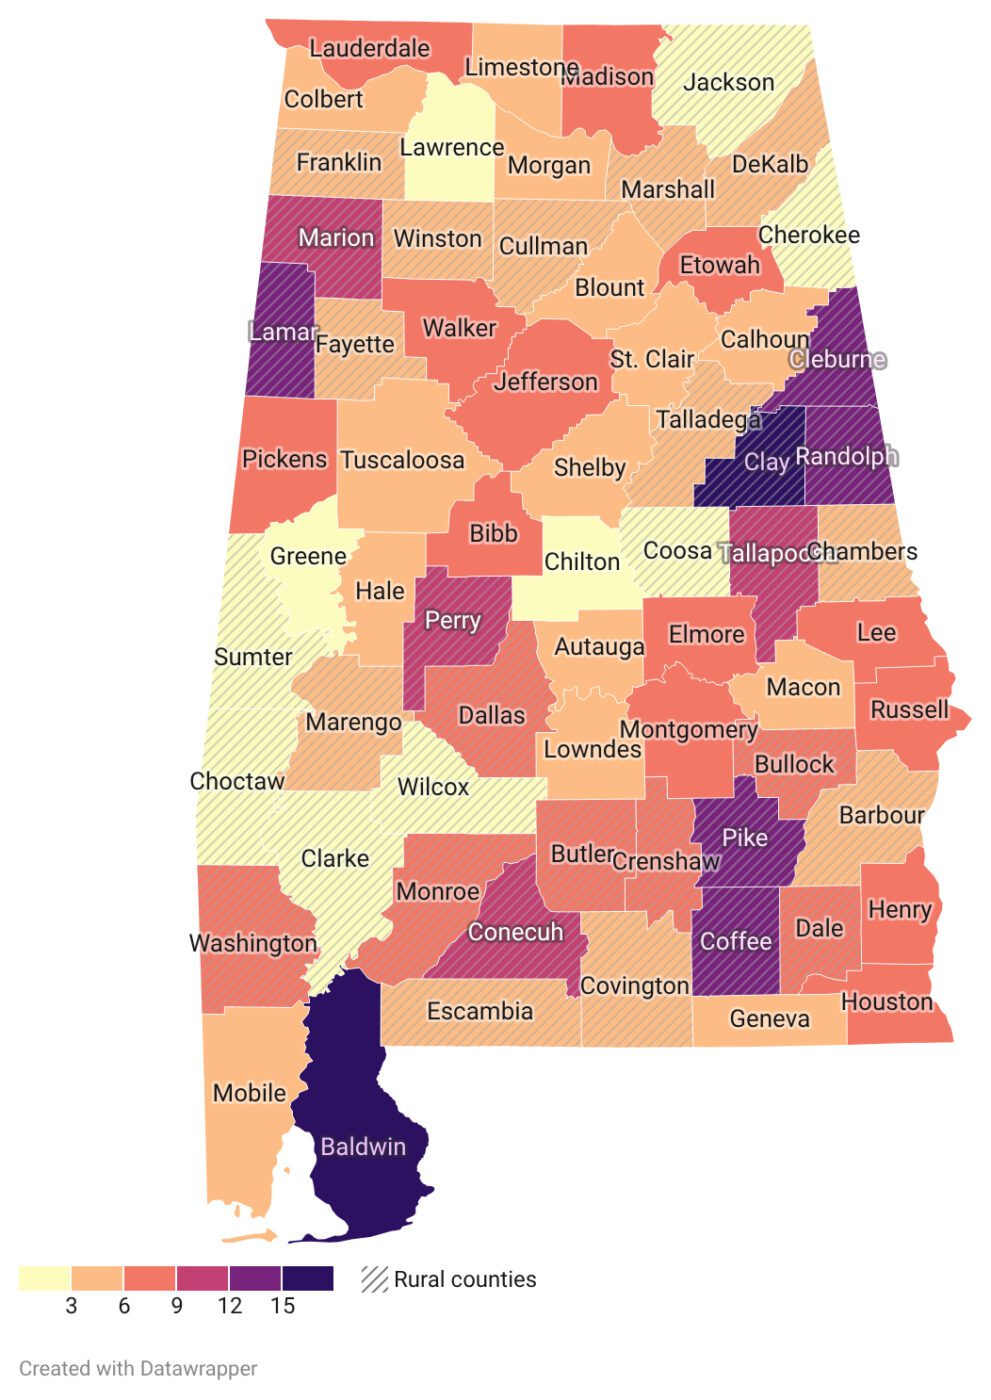
Figure 3. Rental vacancy rates, 2024. (Source: American Community Survey)
Housing Tenure
Housing tenure measures the percentage of housing units occupied by the owner. This measure reflects how individuals may choose to own or rent based on the desire for flexibility, stability in place, or financial readiness for the purchase of a house. It is not better or worse to have more owner-occupied units versus rented units; it is simply an indicator of the percentage of individuals who own their home in an area.
In Alabama, the counties that have the highest percentages of housing units that are owner-occupied are the least populated rural counties (those nonmetro counties with an urban center of fewer than 5,000 people, whether adjacent to a metro area or not), with owner-occupancy rates above 75% (figure 4). Conversely, the counties with the highest rate of renter-occupancy are those in metro areas of 250,000 to 1 million population. All other county types are around 70% owner-occupied. These trends have held steady over the last 15 years, with only minor shifts of 1 or 2 percentage points year over year.
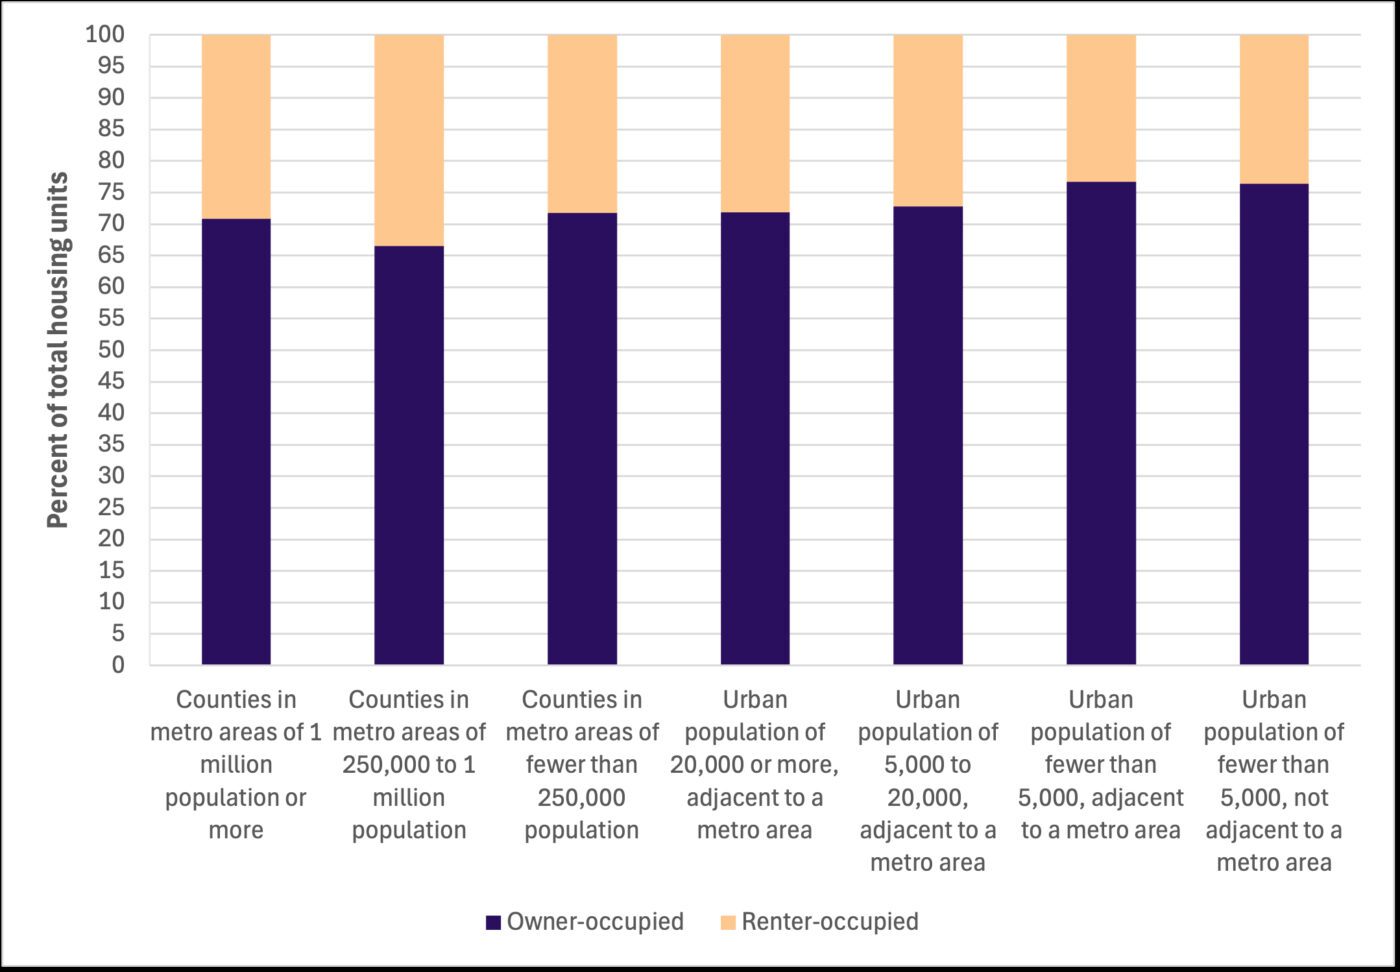
Figure 4. Percent of housing units that are owner-occupied, 2024. (Source: American Community Survey)
Housing Structure
Housing structure refers to the type of housing unit, including single-family houses, apartment buildings with multiple units, mobile homes, etc.1
The percentage of single-family houses (including duplexes and townhouses) is relatively similar across county types, at approximately 65 to 72%, from the most urban to the most rural counties (figure 5). Notably, in urban counties, a greater percentage of housing units are in multi-unit structures (e.g., apartments), whereas in rural counties, a greater percentage of housing units are mobile homes. Figure 6 shows the geographic variation in the percentage of housing units that are mobile homes, boats, RVs, etc.
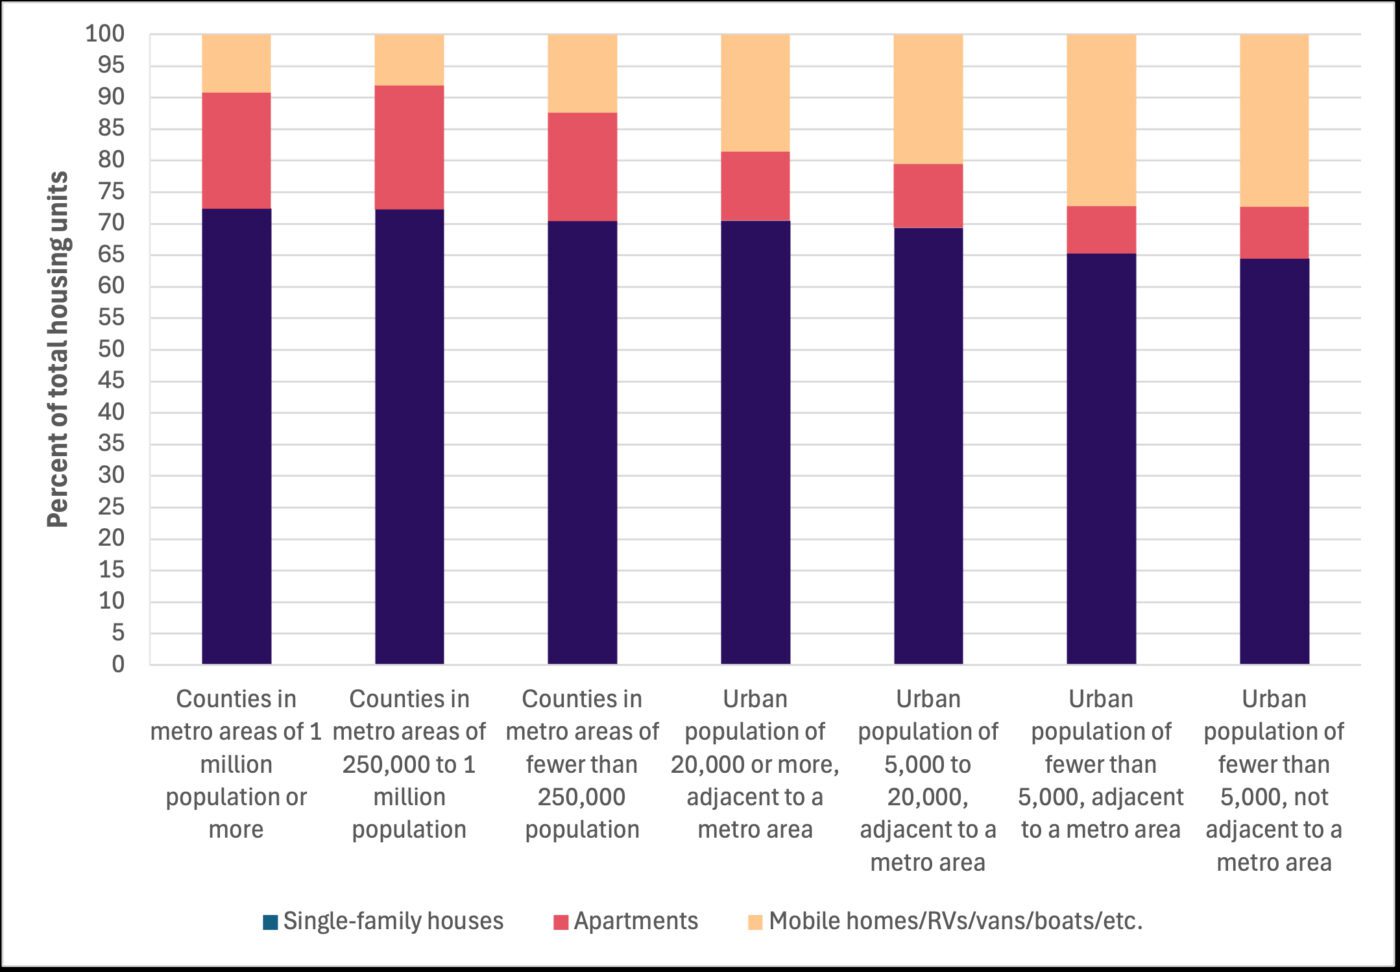
Figure 5. Percent of housing units in various structure types, 2024. (Source: American Community Survey).
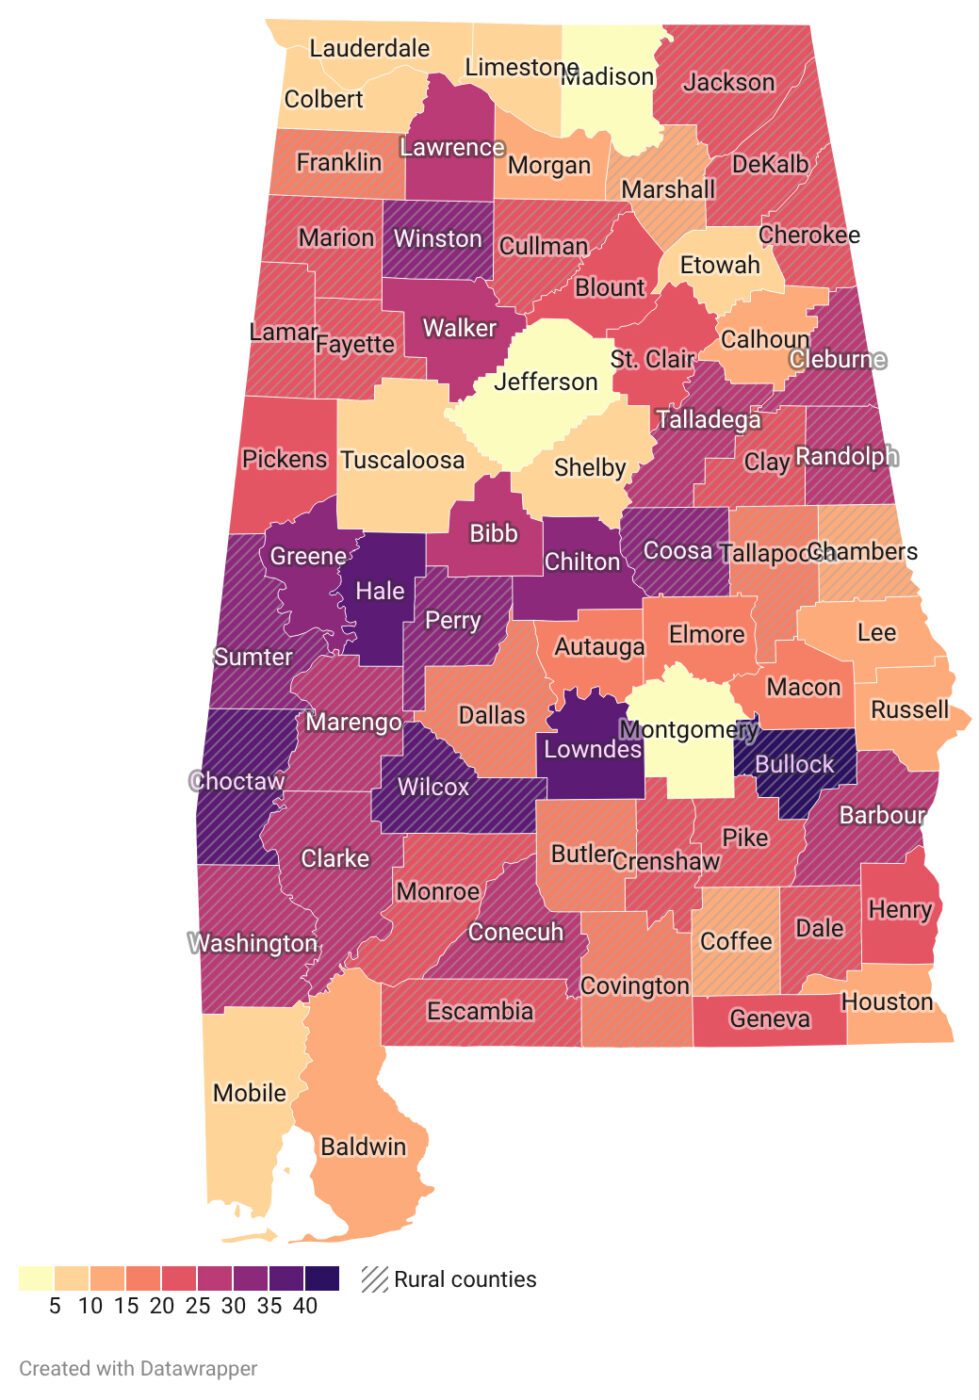
Figure 6. Percent of housing units that are mobile homes/RVs/ boats/etc., 2024. (Source: American Community Survey)
Affordability
Housing costs can be a significant portion of household income. Households that spend more than one-third of their income on housing are considered cost-burdened, so high percentages of households paying more than 35% of their income for housing indicate affordability issues. For this report, housing costs for homeowners can include a mortgage payment, property taxes, insurance, and utilities. For renters, housing costs include rental payments and utilities.
Only about 10% of homeowners with no mortgage spend more than 35% of their household income on housing, whereas approximately 20% of homeowners with a mortgage do so (figure 7). Furthermore, 35 to 40% of renting residents spend more than 35% of their household income on housing. The determining factor is homeowner status, as the number of residents spending greater than 35% of their household income on housing is remarkably similar between urban and rural residents. These housing trends relating to affordability have been consistent across Alabama since 2010.
While there is no notable difference between rural and urban counties overall, some regions of the state are more cost-burdened (figure 8). Across all types of housing tenure, roughly a quarter of households pay more than 35% of their income for housing costs. This trend appears across the state, indicating residents may struggle with housing affordability.
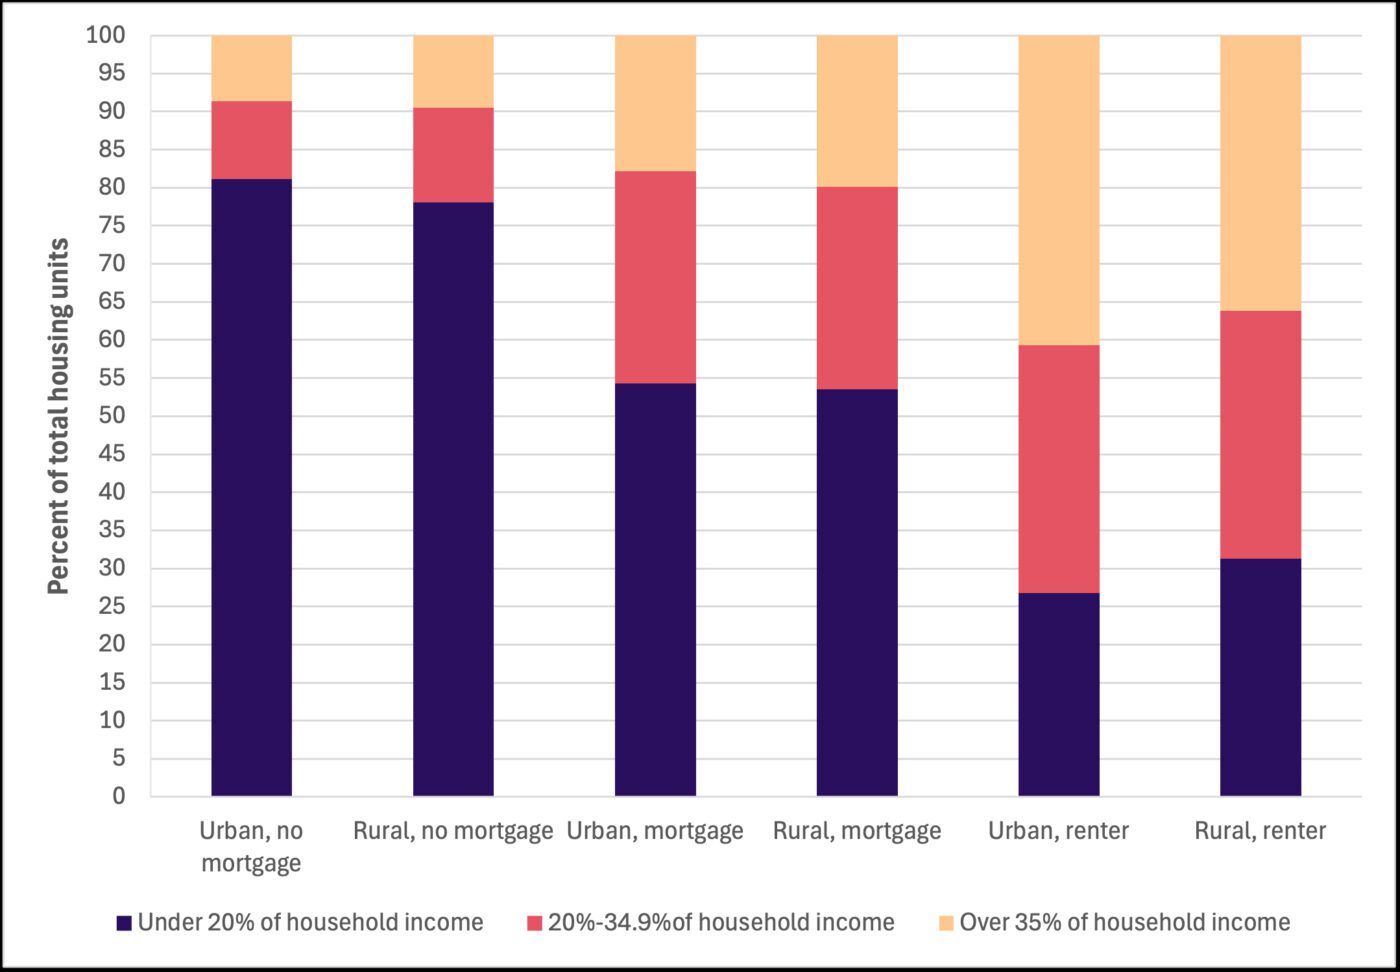
Figure 7. Housing costs as a percentage of household income, 2024. (Source: American Community Survey)
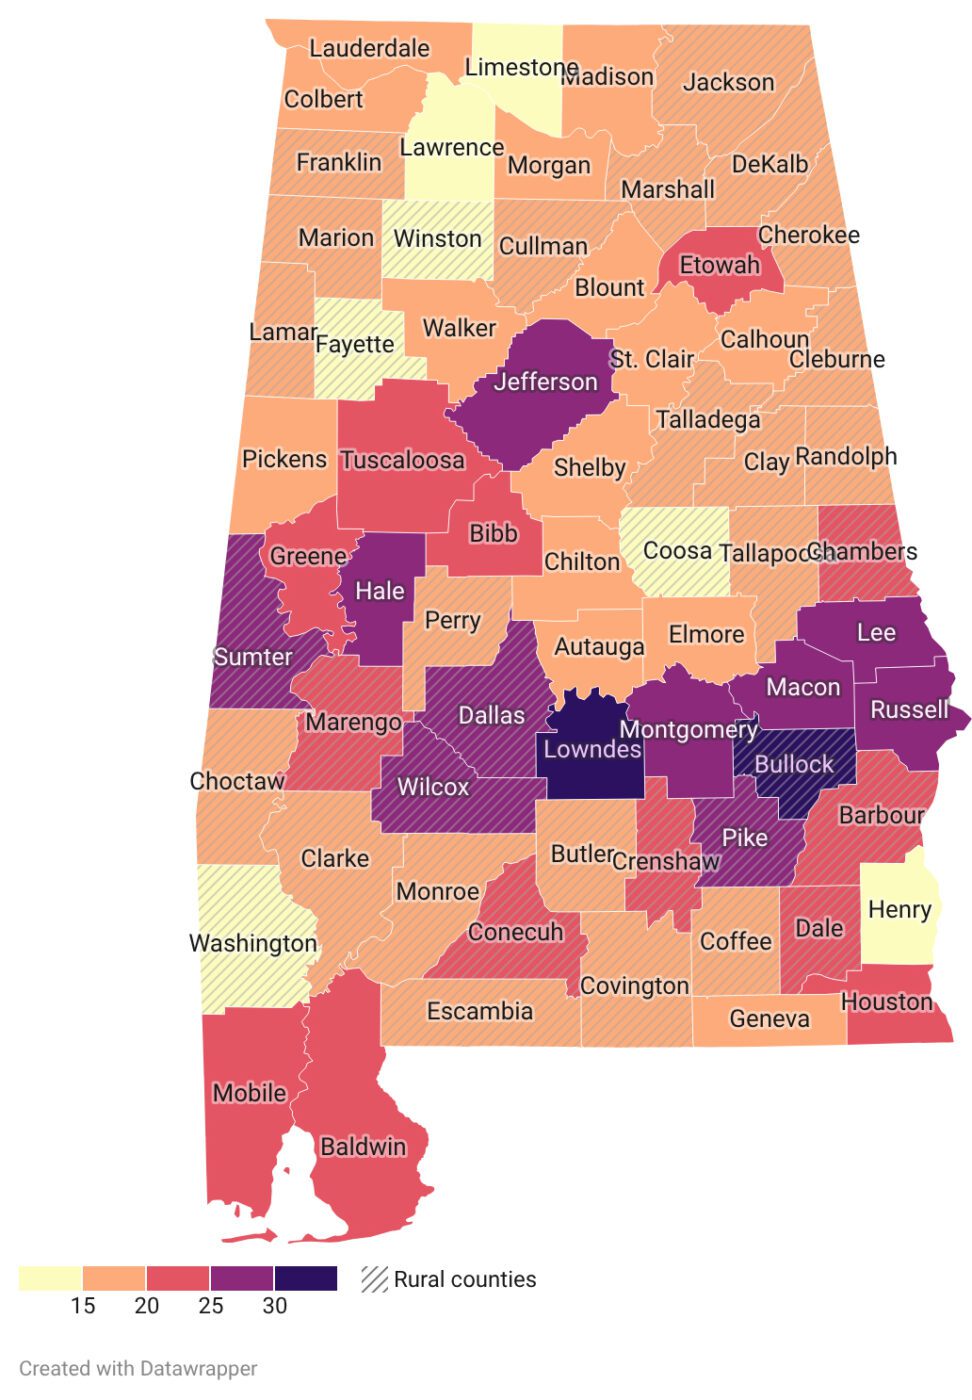
Figure 8. Percent of all housing units that pay more than 35% of household income in housing costs, 2024 (Source: American Community Survey)
Conclusion
While vacancy rates and affordability concerns are similar between rural and urban counties, housing structure type differs significantly, with rural counties having more mobile home housing units, compared to urban counties, which have more multi-unit housing units. The rates of owner-occupied housing tenure are highest in the most urban and most rural counties and has been historically stable. Regardless of county, housing affordability is a key concern, particularly for renters. As communities change over time, community decision makers should consider housing tenure, vacancy rates, housing structures, and housing affordability as significant factors in community planning.

Madison Harris, Research Assistant; Matthew J. Zinsli, Postdoctoral Fellow; and Kelli J. Russell, Assistant Professor, all with Agricultural Economics and Rural Sociology at Auburn University
New September 2026, Alabama in Focus: Housing Trends, ANR-3284
For more information, contact your county Extension office. Visit aces.edu/directory.
Trade and brand names used in this publication are given for information purposes only. No guarantee, endorsement, or discrimination among comparable products is intended or implied by the Alabama Cooperative Extension System.