Farm Management

This publication summarizes recent health trends in Alabama, drawing on data from the last decade from government and academic sources.1 The focus is to illustrate health care metrics in Alabama, with attention to the differences between rural and urban areas. Health, as well as health care access and outcomes, are important factors in community well-being, and understanding health and health care trends is a vital part of planning for a county’s or a community’s future.
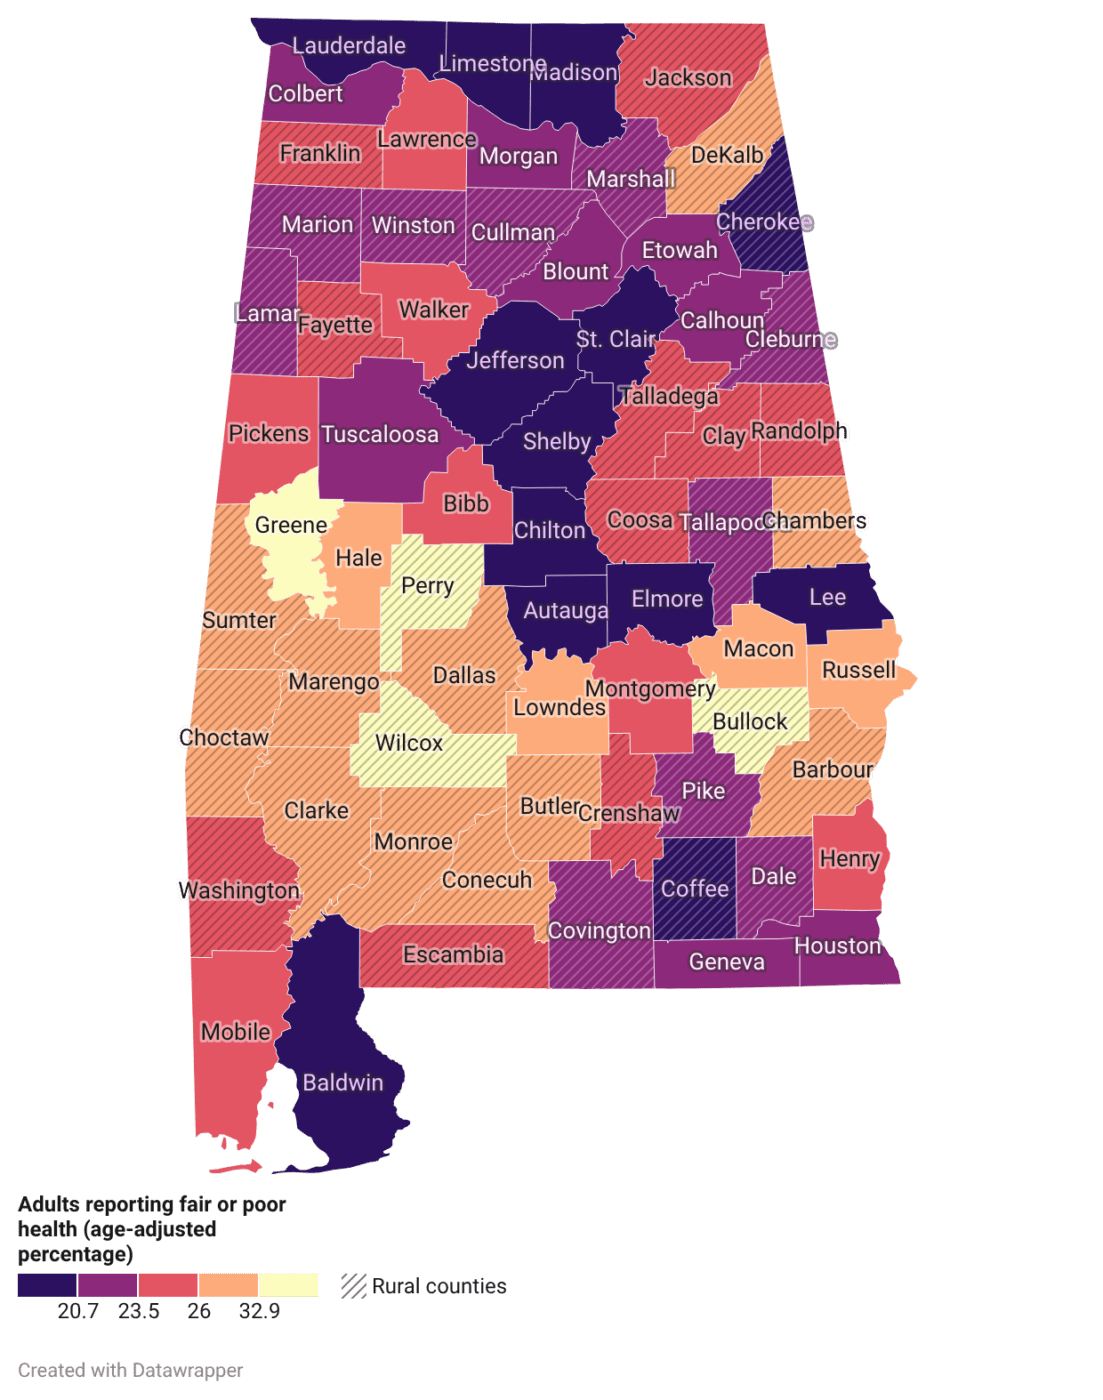
Figure 1. Percentage of adults reporting fair or poor health in Alabama counties (2025). Source: Behavioral Risk Factor Surveillance System.
Health Valuation
Health is a key component in understanding not only personal well-being but also community well-being. Understanding overall population health requires considering both individual health and quality of life, which can be measured by the percentage of adults who report having fair or poor overall health. Figures 1 and 2 show that residents of rural counties report fair or poor health more often than those in urban counties. Urban counties, such as Lee, Limestone, Jefferson, and Shelby, report fewer incidences of fair or poor health. In contrast, rural counties, such as Perry, Wilcox, and Bullock, report more incidences of fair or poor health.
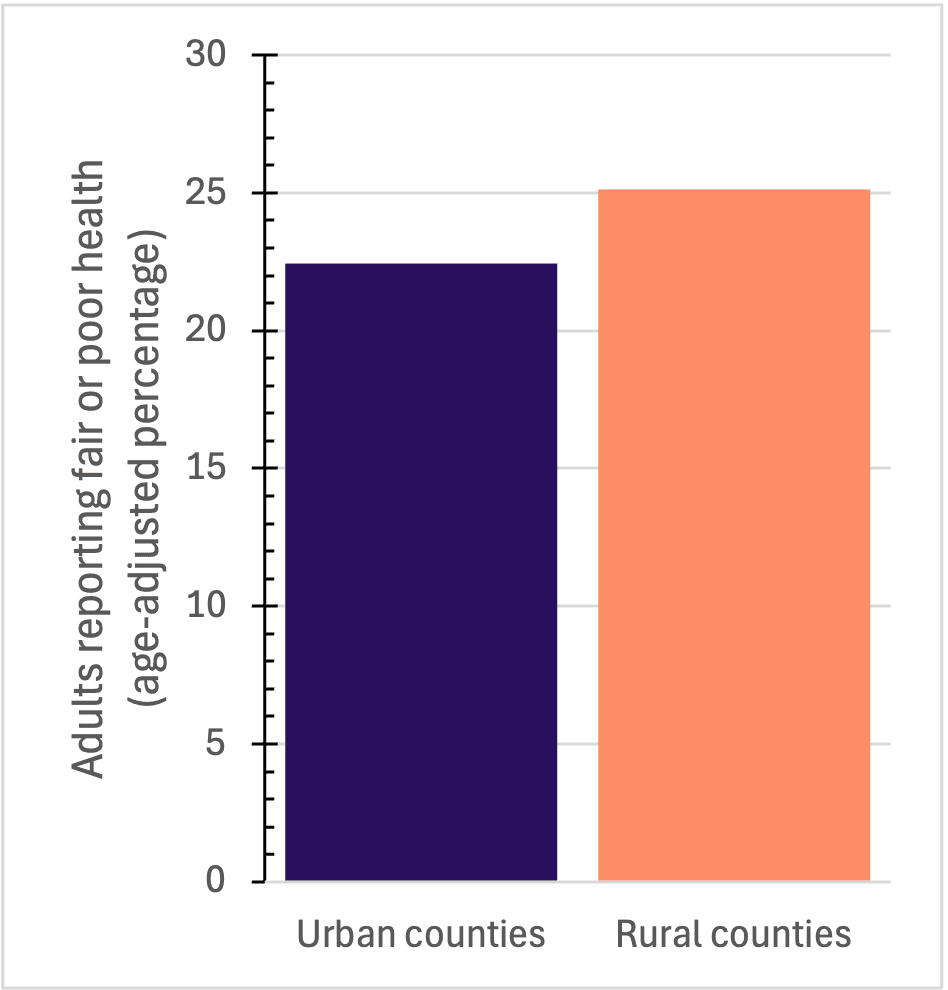
Figure 2. Percentage of adults reporting fair or poor health in Alabama counties (2025). Source: Behavioral Risk Factor Surveillance System.
Access to Health Care
Various measures of health care access indicate that rural populations have significantly less access than their urban counterparts. Over the last decade, in both rural and urban counties, the rate of primary care providers and dentists has remained fairly constant, and the number of mental health care providers has increased. Yet including all categories of access (primary care, dentistry, and mental health care), urban counties have more than 200 providers per 100,000 population. In comparison, rural counties have only slightly more than 125 providers per 100,000 population (figure 3). Within each care provider category, rural counties have fewer providers per person.
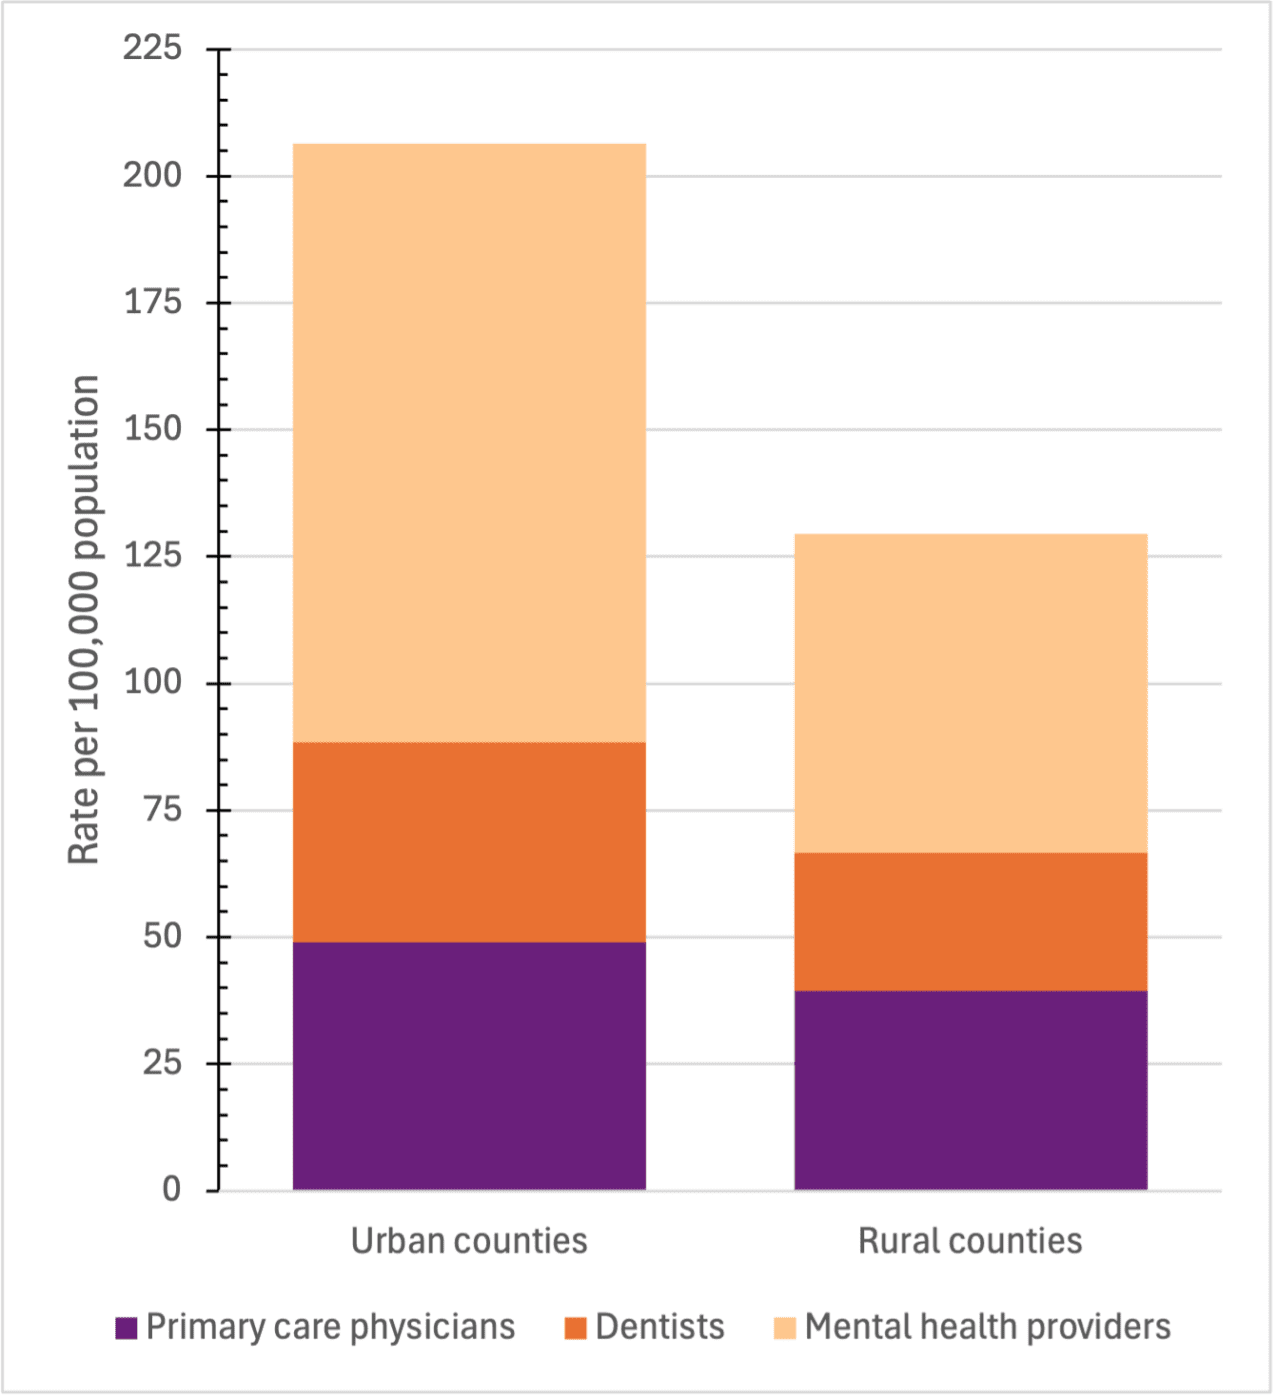
Figure 3. Rate of health care providers in Alabama counties (2025). Sources: Health Resources and Services Administration, American Medical Association, and Centers for Medicare and Medicaid Services.
Life Expectancy
Life expectancy is the average number of years a person is expected to live and is based on many factors, including sex, race, and geographic location. In Alabama, there are notable differences between rural and urban counties in life expectancy (figure 4).
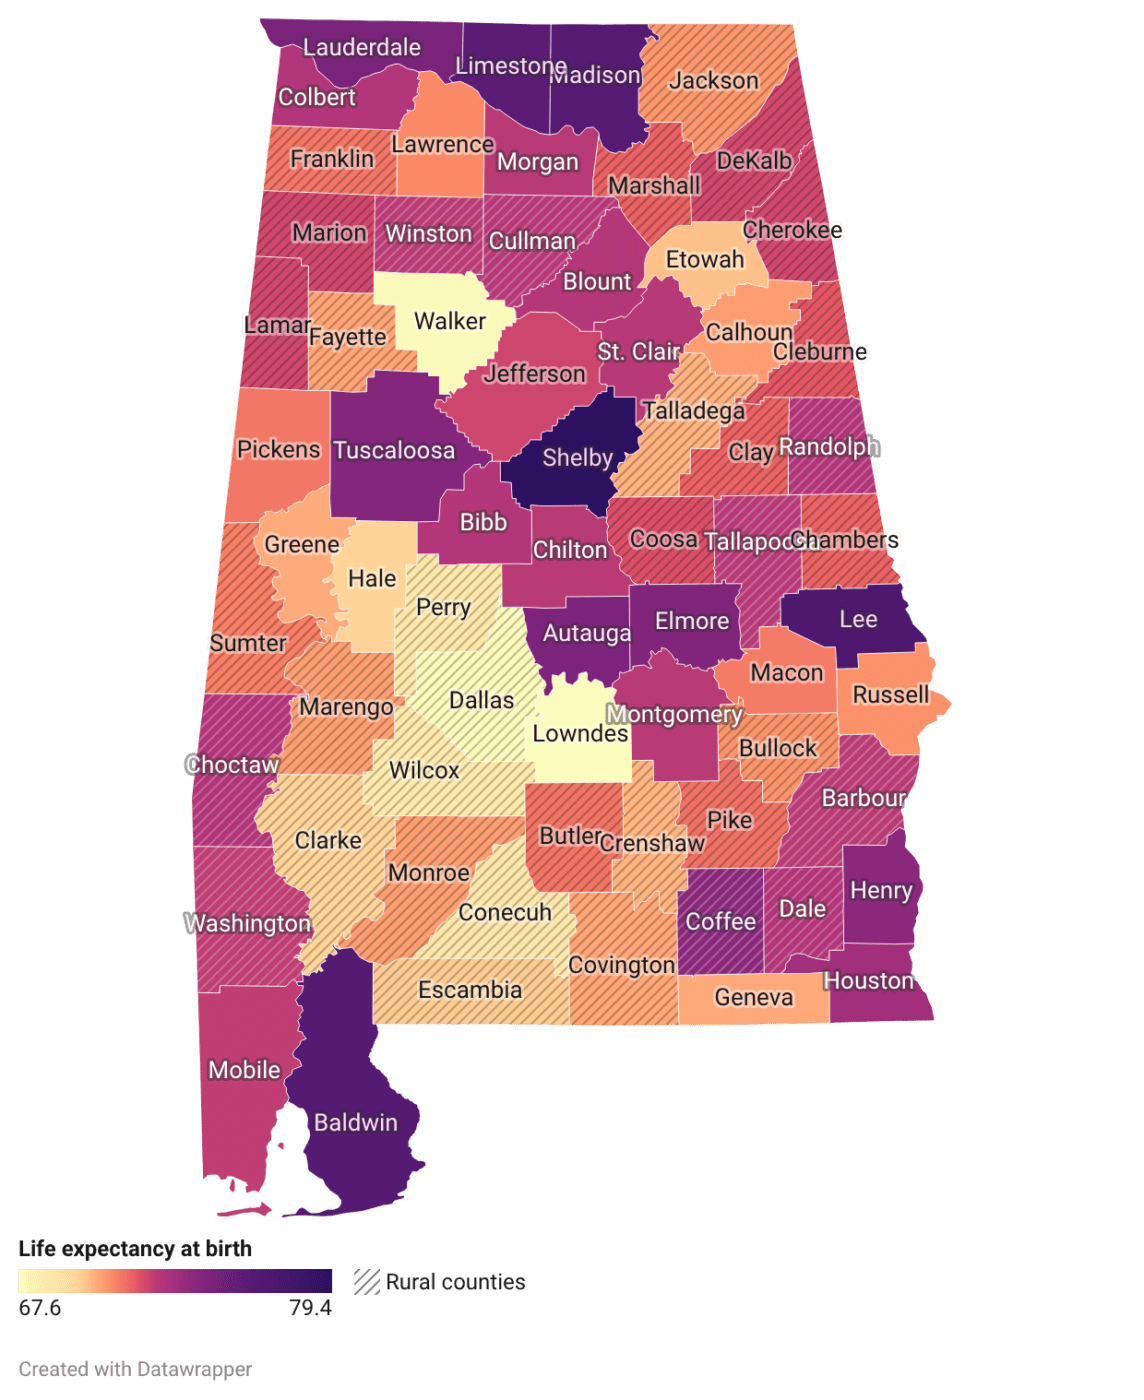
Figure 4. Life expectancy at birth in Alabama counties (2025). Source: National Center for Health Statistics.
Residents of urban counties have a higher life expectancy than those in rural counties. However, there are exceptions, such as Walker and Lowndes Counties, which are considered urban but have significantly lower life expectancies at birth than other urban counties. Overall, rural counties have significantly lower life expectancies, while urban counties have higher life expectancies. Notably, the urban counties with the highest life expectancies, such as Lee, Limestone, Madison, and Shelby, are all close to major cities in Alabama, including Auburn, Huntsville, and Birmingham.
Since 2014, Alabama’s expectancy has declined overall, mirroring a national trend. In Alabama, the gap between rural and urban life expectancies has also been widening over that same time period. This indicates that, while overall life expectancy in Alabama is decreasing, individuals living in rural counties have even shorter life expectancies than those in urban counties. Residents of rural counties generally fare worse in terms of life expectancy than their urban counterparts, with approximately 1 year less of life expectancy in Alabama (figure 5).
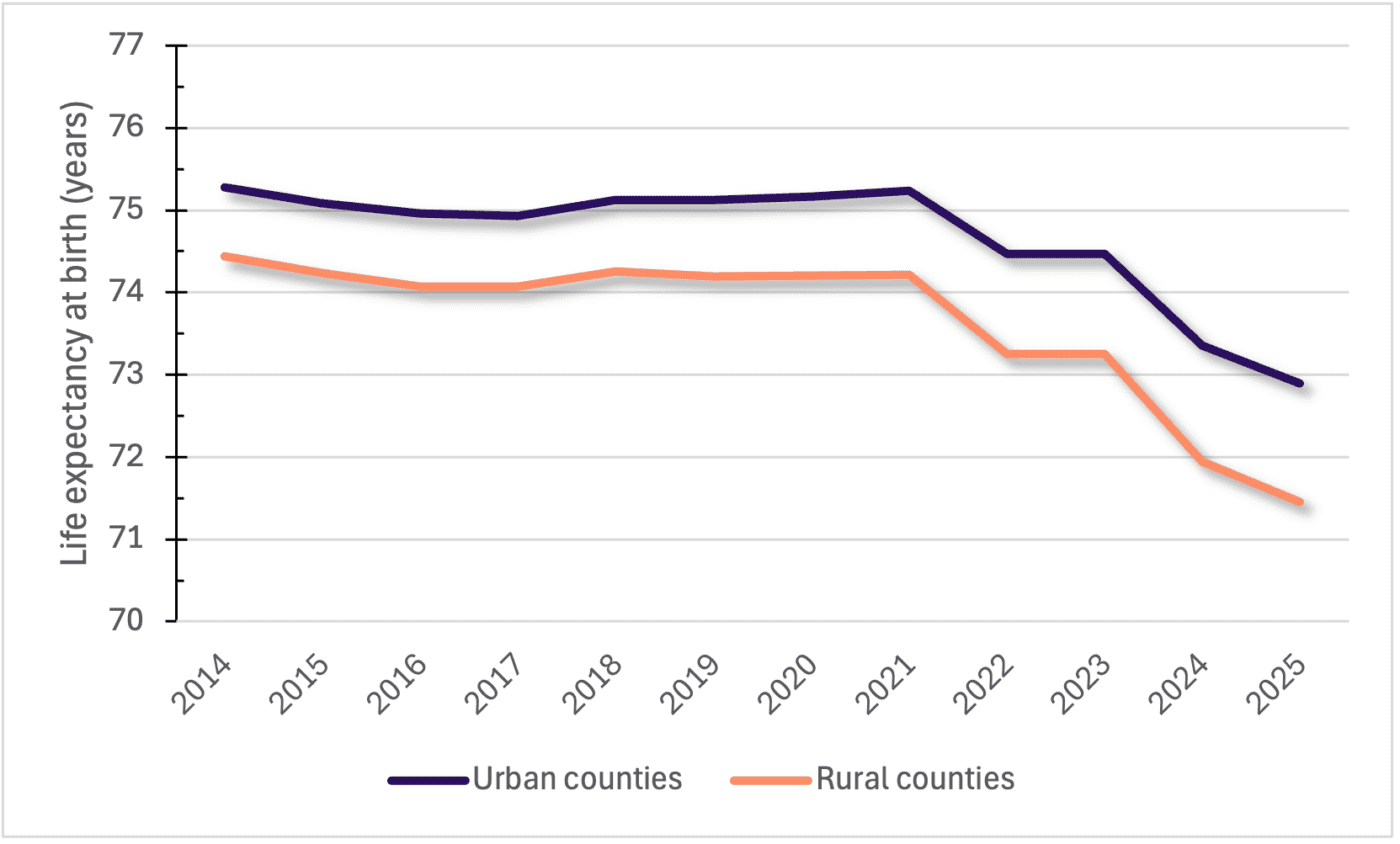
Figure 5. Life expectancy at birth in rural and urban Alabama counties (2014–2025). Sources: Institute for Health Metrics and Evaluation and National Center for Health Statistics.
Another mortality indicator, years of potential life lost, emphasizes the population-wide impact of premature deaths. Rural Alabama counties have higher values for this measure (figure 6), indicating more years of potential life lost than urban counties. This means that rural counties are experiencing more premature deaths among their residents than urban counties. Like the rural-urban life expectancy gap, the years of potential life lost gap has also been increasing in recent years between rural and urban Alabama counties.
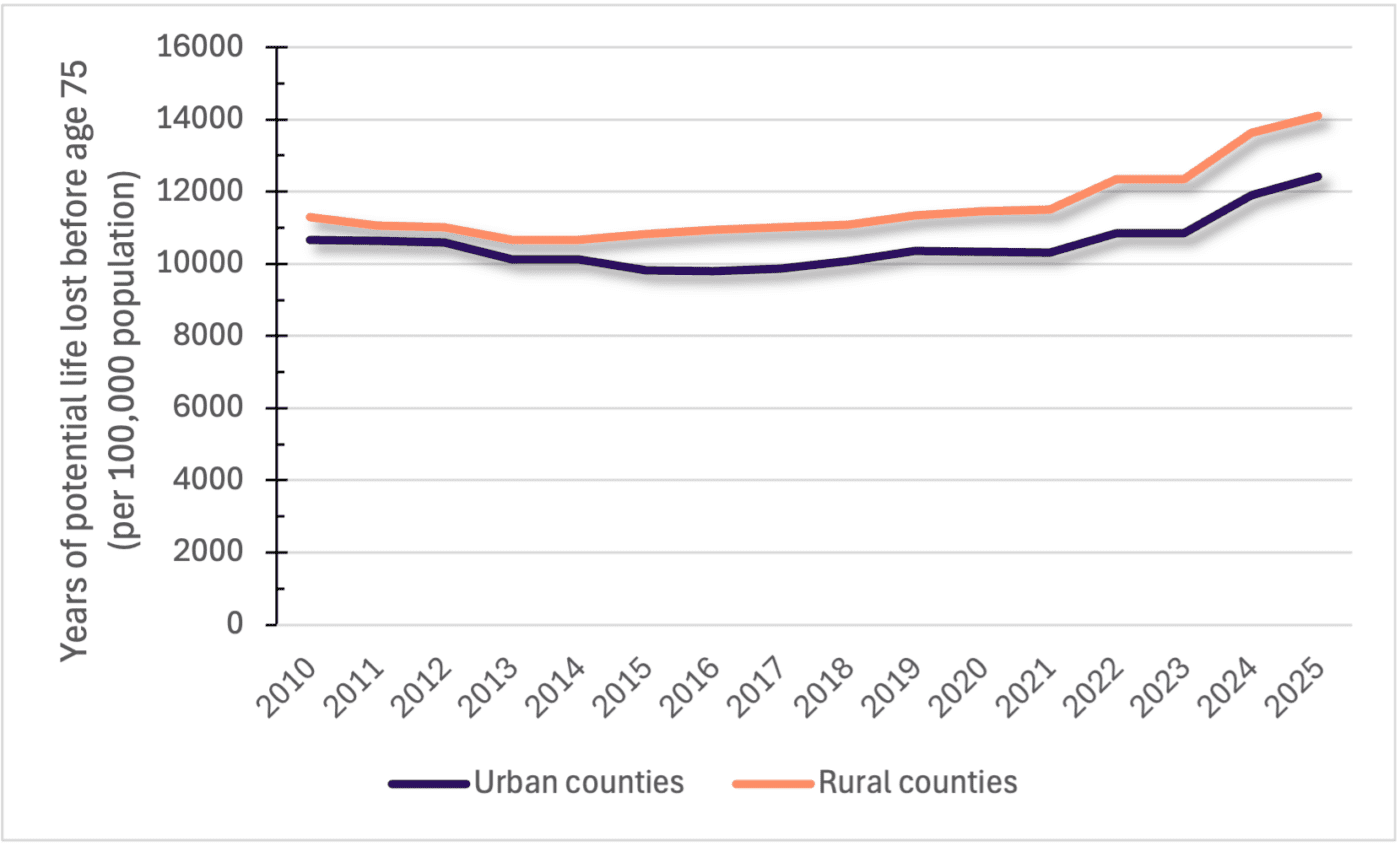
Figure 6. Years of potential life lost in Alabama counties (2010–2025). Source: National Center for Health Statistics.
Another indicator of population health and community well-being is the child mortality rate, defined as the number of deaths under the age of 20 per 100,000 population. In Alabama, rural counties have a higher rate of child mortality than urban counties. The rural county child mortality rate is 88.47 child deaths per 100,000 people, whereas the urban county rate is 73.32 child deaths per 100,000 people (figure 7).
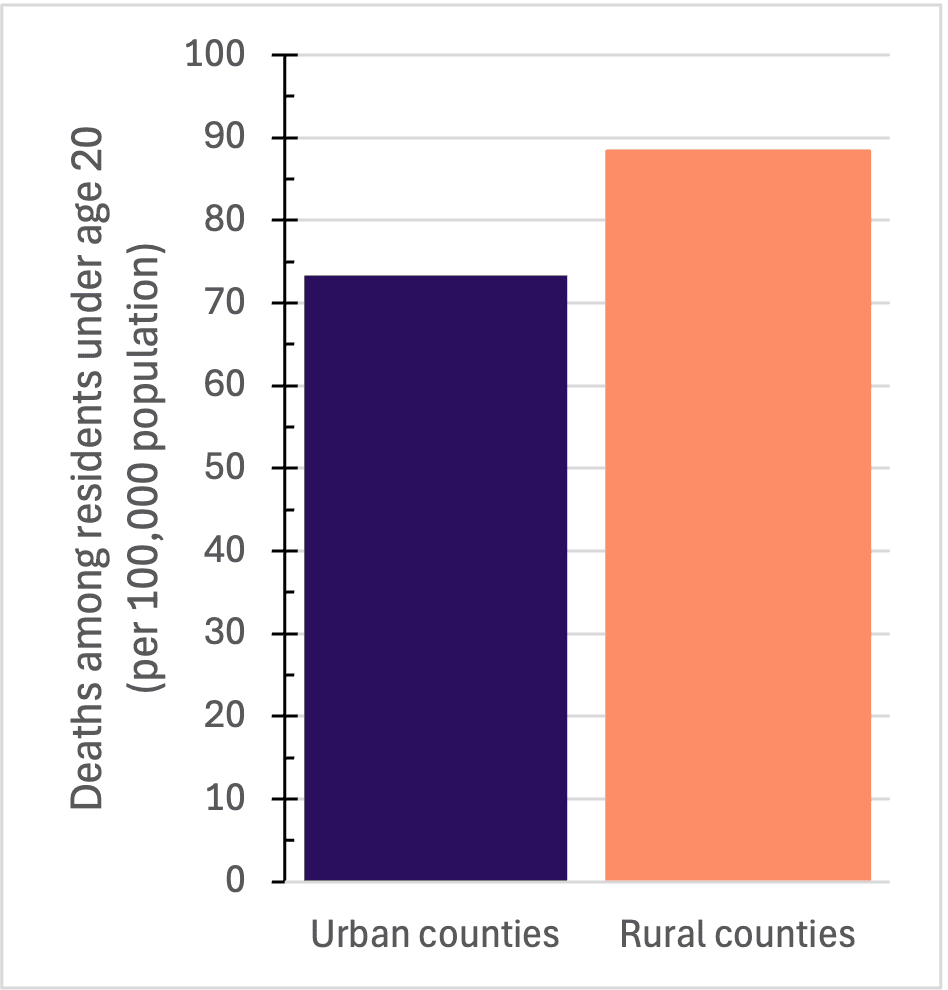
Figure 7. Child mortality rate in Alabama counties (2025). Sources: National Center for Health Statistics and Census Population Estimates Program. Bar chart comparing deaths among residents under age 20 per 100,000 population in urban and rural counties. Rural counties have a higher death rate, about 88 per 100,000, compared to approximately 73 per 100,000 in urban counties.
Conclusion
Examining health care access and life expectancy trends at the county level in Alabama reveals significant differences between rural and urban counties. Rural counties fare worse in every category, as they experience lower life expectancies, more premature and childhood deaths, and less access to health care providers. These trends and differences between rural and urban areas are important factors for community leaders and policymakers investing in community well-being and improving health care access across the state.
1Data sources include the Institute for Health Metrics and Evaluation, the National Center for Health Statistics, the US Census Population Estimates Program, the Behavioral Risk Factor Surveillance System, the Health Resources and Services Administration, the American Medical Association, and the Centers for Medicare and Medicaid Services.
 Madison Harris, Research Assistant; Matthew J. Zinsli, Postdoctoral Fellow; Kelli J. Russell, Assistant Extension Professor; and Mykel R. Taylor, Department Head, Professor, and ALFA Endowed Chair, all in Agricultural Economics and Rural Sociology, Auburn University
New April 2026, Alabama in Focus: Health Trends, ANR-3252