Crop Production
Learn how the adoption of conservation practices has changed in Alabama agriculture since 2012.
Emerging voluntary carbon markets are attracting attention in US agriculture to the extent that agriculture carbon credits are referred to as the new cash crop. In essence, large companies would purchase carbon credits from multiple sources, including agriculture, to achieve their net zero emission goals. Farmers and ranchers would implement conservation practices that sequester carbon or provide other environmental benefits in exchange for cash compensation or carbon credits, depending on the carbon program.
Not all conservation practices do generate carbon credits. In order to do so, conservation practices must meet two major requirements: additionality and permanence. Additionality requires that practices be additional, or different from, the baseline and requires judgement on whether the practice would have been implemented in the absence of the carbon program. Permanence refers to the length of time that carbon is sequestered from the atmosphere as a result of implementing of a specific practice.
A key challenge that annual conservation practices such as cover cropping and no-till face is the permanence of the sequestered carbon in the soil. If a farm discontinues the use of cover crops or if vertical tillage is implemented on a farm after several years of no-till (to manage weed pressure or excess moisture in the soil, for example), then sequestered carbon from previous conservation practices leaves the soil and returns to the atmosphere. The risk of this so-called reversal is addressed by some carbon programs through a voluntary carbon reserve that consists of carbon credits generated by agricultural practices that are kept outside the carbon market untraded for 10 years or more. In those cases, the amount of agriculture carbon credits available for sale is smaller than the total number of carbon credits generated by farmers.
When a practice is temporarily discontinued because of external factors (primarily weather), most carbon programs impose penalties such as skipping payments for the discontinued practices until reinstated and not counting incomplete practices toward carbon credits.
In the current environment of burgeoning agriculture carbon programs, little attention has been paid to the potential effects of alternating adoption, opportunistic adoption, and partial adoption on total area under conservation practices, let alone their limiting effects on the development of voluntary carbon markets.
Unfortunately, there is no farm-level longitudinal study on the drivers and associated probability of temporary or permanent disadoption of conservation practices. However, using county-level data from the 2012 and 2017 US Censuses of Agriculture, regional patterns of adoption and disadoption of conservation practices in the United States were evaluated. Researchers estimate that national disadoption rates in cover crops and no-till averaged 15.60 and 39.38 percent, respectively, between censuses.
Use of Cover Crops in Alabama
In 2017, Alabama ranked 14th in the U.S., with cover crops planted on 8.1 percent of its cropland, totaling 229,097 cover crop acres statewide. Total cropland acres are calculated as the sum of planted (harvested, pastured, and failed) plus not planted (summer fallow and idle) acres. Cover crop adoption varied greatly across the state as shown in figure 1, with Baldwin County leading the way with cover crops on 35.6 percent of its cropland. Colbert County was last, with only 0.3 percent of cropland in cover crops. The disparities in conservation practice use are partially due to differences in soil type and crops grown.
Between 2012 and 2017, Alabama increased its total cropland in cover crops by 27,739 acres. The percentage of cropland with cover crops increased from 7.2 to 8.1 percent during that time. An analysis of adoption rate changes by county shows that 37 counties (55 percent) in Alabama saw increases in cover crop acreage between 2012 and 2017 (figure 2). Baldwin County led the way with a net increase of 21,617 cover crop acres. However, the 30 counties in the state (shaded blue in figure 2) that experienced disadoption between 2012 and 2017 had cover crop acreage decrease by 43,292 acres total. The disadoption was led by Madison County, which had 6,711 fewer cover crop acres in 2017 than in 2012. The 43,292-acre decline represents 32 percent of the 2012 cover crop acreage in the counties that experienced declining adoption rates. The observed changes in cover crop acreage could reflect crop rotations, for example, not using cover crops before corn.
-
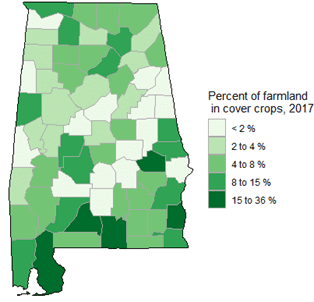
- Figure 1. Percentage of Alabama cropland in cover crops in 2017.
-
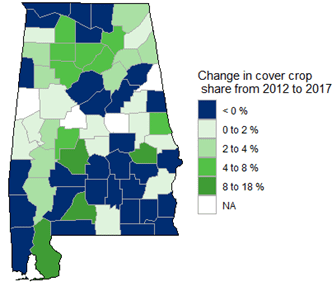
- Figure 2. Change in percentage of Alabama farmland in cover crops from 2012 to 2017.
No-till Use in Alabama
In 2017, no-till was used on 765,356 acres, or 27.2 percent, of cropland in Alabama. The no-till share ranked 18th in the U.S. The counties with the highest rates of no-till adoption tend to be in the Tennessee Valley region of the state, as shown in figure 3. Cherokee County had the highest no-till rate at 70.5 percent, and Wilcox County had the lowest at 0.9 percent. The disparity of no-till use is likely in part due to the high presence of highly erodible land in the northern part of the state. Farmers are required to follow conservation compliance provisions to participate in USDA programs on land that is designated as highly erodible. No-till or other conservation tillage methods are often used to comply with these provisions.
Alabama saw its share of cropland with no-till increase from 25.7 percent in 2012, an increase of 55,263 acres. Thirty-six counties had net increases in no-till acreage from 2012 to 2017, while the 31 counties that saw decreases had a 20,940-acre decline (figure 4). This decline represents 6 percent of 2012 no-till acreage among the counties that had net disadoption. The biggest movers were Madison County, which had an increase of 11,271 no-till acres, and Morgan County, which had a decrease of 7,002 no-till acres between 2012 and 2017. While voluntary carbon programs will likely penalize a temporary disadoption of cover crops by temporarily discontinuing the accumulation of partial carbon credits, a carbon reversal from a temporary disadoption of no-till could have much harsher consequences, ranging from losing accumulated credits to monetary sanctions.
-
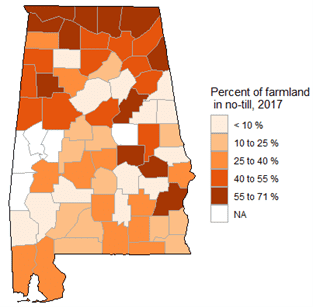
- Figure 3. Percentage of Alabama cropland using no-till in 2017.
-
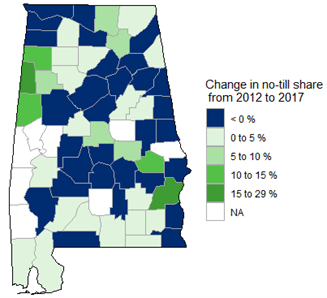
- Figure 4. Change in percentage of Alabama farmland using no-till from 2012 to 2017.
Summary
This article highlights the nonpermanence of two annual conservation practices between 2012 and 2017 in Alabama: in 45 and 46 percent of the counties in the state, cover crops and no-till were disadopted, reducing the areas in those conservation practices by 32 and 6 percent of their 2012 levels, respectively. If these percentages are indicative of the probability that farmers participating in voluntary carbon programs could temporarily discontinue contracted practices and incur penalties from carbon programs, data suggests that farmers planting cover crops and using no-till would
not incur major penalties over the life of a multi-year carbon contract.
References
- Pannell, D.J., and R. Claasen. 2020. “The Roles of Adoption and Behavior Change in Agricultural Policy.” Applied Economics Perspectives and Policy 42(1):31–41.
- Sawadgo, W. and A. Plastina. 2022. “The Invisible Elephant: Disadoption of Conservation Practices in the United States” Choices. Quarter 1. Available online.
- US Department of Agriculture (USDA). 2021. Farm Income and Wealth Statistics. Economic Research Service. Washington, D.C., September 2.
 Wendiam Sawadgo, Extension Economist, Assistant Professor, Agricultural Economics and Rural Sociology, Auburn University, and Alejandro Plastina, Associate Professor, Economics, Iowa State University
New May 2022, Cover Crops and No-Till in Alabama: Permanence and Carbon Markets, ANR-2891