Crop Production
Many nursery growers assume that their irrigation system applies water uniformly over plants; however, many systems are inefficiently designed or require repair. This second of a three-part series looks at a method for measuring distribution uniformity.
Distribution uniformity (DU) measures how evenly water is applied to an irrigated area. It is important to maintain a high DU, so that all the containers in an irrigation area are getting similar amounts of water. If DU is low, some plants may be underwatered, while others may receive excess water. This can lead to issues with plant uniformity and losses due to drought stress or disease pressure.
A DU of 80 percent or more is considered a best management practice (BMP) by the Southern Nursery Association. A DU lower than 80 percent may indicate that where improvements can be made. A DU lower than 60 percent indicates poor system design or hardware malfunctions.
A 2019 audit of nine container nurseries in Alabama found that uniformity might be an unrealized problem in many nurseries. All nine of the nurseries visited fell below the BMP guidelines of 80 percent or more. One nursery that was audited had a uniformity of 65 percent, and because of this, some areas in the block received 0.1 inches of irrigation while others received 0.7 inches. Improving DU in overhead irrigation systems has the potential not only to reduce irrigation run time and volume of water but also to improve leaching fraction (LF) by distributing water more evenly. Leaching fraction is the percentage of applied water that leaches from a container. Ideally, this percentage should be low, around 15 percent. It has been shown that reducing LF to 15 percent can increase production by keeping more fertilizer in the root zone.
Table 1. Comparison of Distribution Uniformity of Leaching Fraction in Three Nurseries in 2019
| Nursery | Distribution Uniformity | Average Leaching Fraction | Leaching Fraction Range |
|---|---|---|---|
| A | 66% | 36.4% | 5.0% 67.2% |
| B | 72% | 17.2% | 3.9% 41.2% |
| C | 78% | 8.6% | 4.3% 13.3% |
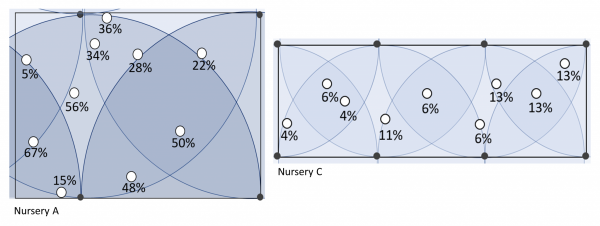
Figure 1. Visual comparison of percent LF samples taken at two nurseries in 2019. Notice the wide range of LF values in Nursery A (DU of 66 percent) compared to the much smaller range in Nursery C (DU of 78 percent).
Table 1 compares three nurseries from the 2019 audit. Data from these nurseries demonstrate how improvements in DU reduced the overall average LF. Improving uniformity also narrowed the LF range, indicating that the plants are getting very similar amounts of irrigation across the block. For more information on LF, see Extension publication ANR-2706, “Auditing Overhead Irrigation Systems in Container Nurseries: Leaching Fraction.” In the visual comparison, notice the wide range of LF values in Nursery A, which had a DU of only 66 percent, compared to the much smaller range in Nursery C, which had a DU of 78 percent (figure 1).
Measuring DU
Calculating DU can be easily done using collection cups, a graduated measuring cup, and the following method:
- Place a minimum of 16 identical collection cups in a uniform grid pattern within an overhead irrigation area (figures 2 and 3). The more cups the better; however, the number of cups must be divisible by four (16, 24, 32, etc.) for easy calculating.
-
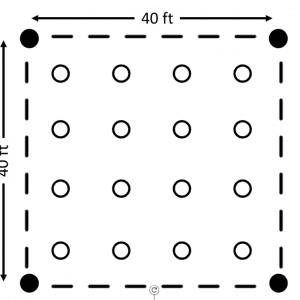
- Figure 2. Placement of sixteen collection cups arranged in a square grid pattern among four sprinklers.
-
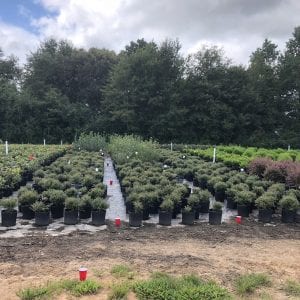
- Figure 3. Drinking cups used to determine distribution uniformity.
- Once the cups are placed, run an irrigation cycle as you usually would.
- After the cycle is complete, measure the amount of water in each of the cups and order from lowest to highest.
- First, determine the lowest quarter of the measurements. For example, if 24 cups were used, the lowest quartile would be the 6 smallest measurements. Then average these values to get
- the average of the lowest quartile.
- Find the average volume of all the cups.
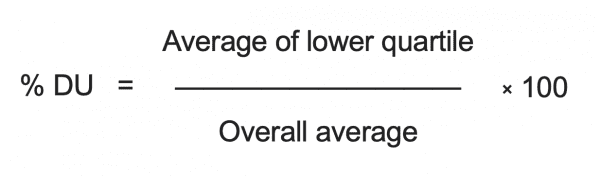
- Using this equation, calculate DU:
% DU = (Average of lower quartile) / (overall average) multiplied by 100
As mentioned earlier, a DU of greater than 80 percent is desirable. A DU of less than 60 percent may indicate larger design problems. If DU is between 60 percent and 80 percent, it may simply be due to malfunctioning hardware, inadequate pressure, or wind drift. In this case, the following solutions may help improve DU:
- Replace worn, broken, or mismatched nozzles.
- Have adequate pressure and flow at the nozzle point.
- Be sure sprinkler risers are vertically oriented and do not move.
- Provide head-to-head coverage.
- Use matched-precipitation rate sprinklers or nozzles
- Use nozzles that produce larger droplets to reduce the effects of wind.
- Use lower trajectory angle sprinkler heads.
Example:
- Irrigation (in mL) collected from 20 irrigation cups, ordered lowest to highest: 17, 17, 21, 21, 25, 26, 26, 26, 28, 28, 28, 30, 31, 31, 32, 32, 32, 32, 32, 34.
- Find the number of values in the lowest quartile = 20 cups ÷ 4 = 5 lowest values.
- Average volume of the lowest quartile = (17 + 17 + 21 + 21 + 25) ÷ 5 = 20.2.
- Average volume of all cups = (17+17+21+21+25 + 26 + 26 + 26 + 28 + 28 + 28 + 30 + 31 + 31 + 32 + 32 + 32 + 32 + 32 + 34) ÷ 20 = 27.45.
- % DU = 20.2 ÷ 27.45 × 100 = 73.6%
Conclusion
Auditing the uniformity of overhead irrigation systems can be help visualize how evenly water is applied. It is important to periodically check DU and to note changes in the system’s performance. Something as simple and easy to fix as a broken head or wobbly riser can greatly improve DU.