Crop Production

Figure 1. Percent of Alabama cropland in cover crops, 2022
The prevalence of voluntary carbon markets has increased in the past several years. Carbon markets pay farmers for adopting practices, such as cover crops and no-till, that sequester carbon.
To generate carbon credits, conservation practices need to fulfill permanence, which refers to the length of time that carbon is sequestered from the atmosphere due to the implementation of a specific practice. Permanence is important as it ensures that the carbon offsets purchased have an enduring impact on carbon storage.
Permanence is a key challenge that cover crops and no-till face. Discontinuation of cover crops can stop carbon sequestration. Even more significant, if a farm implements vertical tillage after several years of no-till (e.g., to manage weed pressure or excess moisture in the soil), then sequestered carbon from previous conservation practices leaves the soil and returns to the atmosphere. As a result, most carbon programs include penalties for temporarily discontinued practices such as skipping payments until the practice is reinstated and not counting incomplete practices toward carbon credit generation.
To evaluate potential threats to the permanence of conservation practices, this publication evaluates county-level patterns of adoption and disadoption of cover crops and no-till in Alabama using data from the 2017 and 2022 US Censuses of Agriculture.
Cover Crops in Alabama
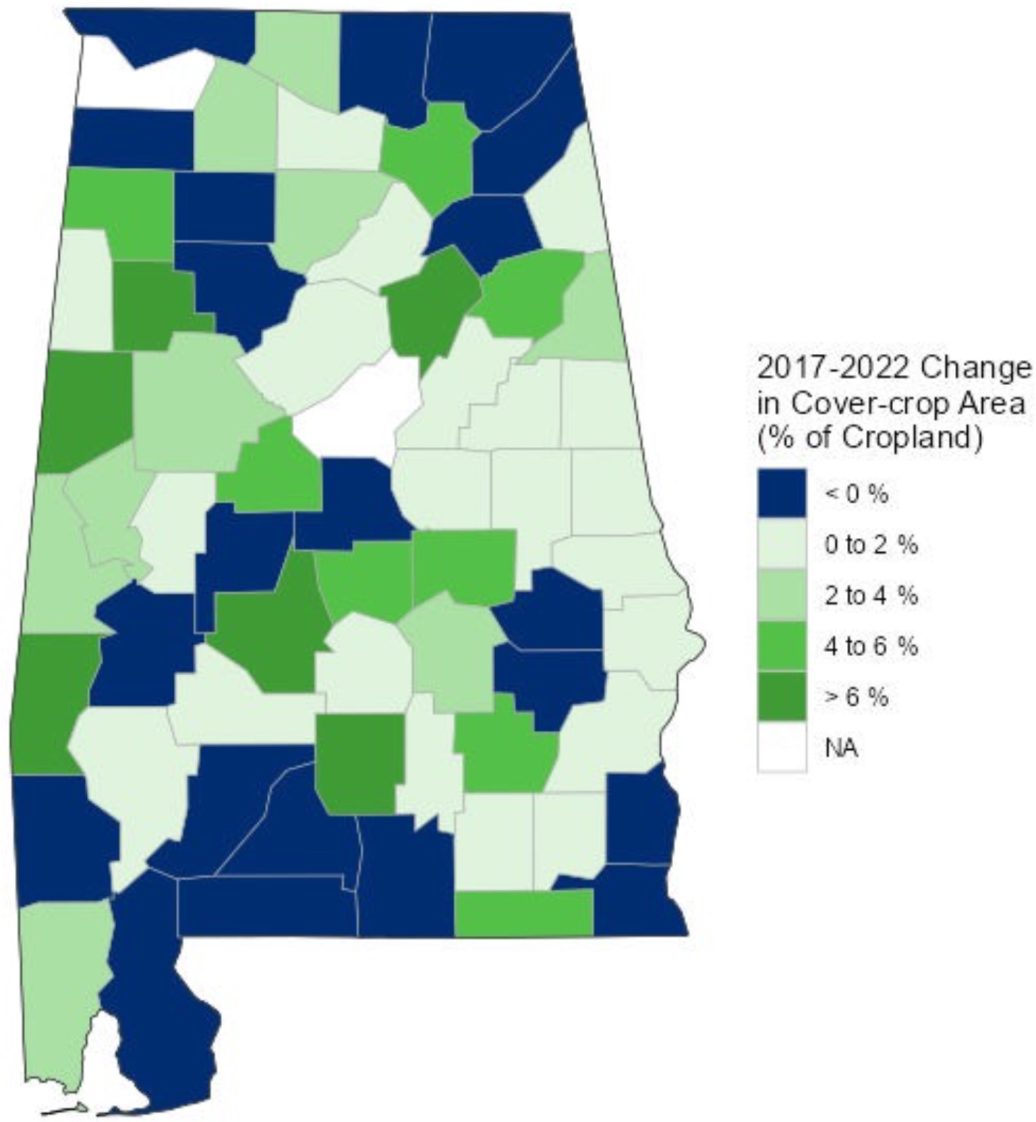
Figure 2. Change in percent of Alabama farmland in cover crops from 2017 to 2022
In 2022, Alabama had cover crops on 7.6 percent of its cropland, totaling 219,354 cover crop acres statewide. There has been a small decrease of 9,743 cover-crop acres in the state since 2017. However, Alabama still surpassed the national average as the United States in total had cover crops on 4.7 percent of its cropland. Alabama ranked eighteenth in the United States in terms of percent of cropland in cover crops.
There was great variability in the intensity of adoption across the state as shown in figure 1. Pickens County led the way with cover crops on 23.1 percent of its cropland, ranking seventy-first nationally (out of 2,897 counties). Etowah County was last in the state with just 0.6 percent of cropland in cover crops. The disparities in conservation practice use can be due to differences in soil type, crops grown, and costs and benefits of using cover crops across the state.
Despite the decrease in Alabama’s cover-cropped land between 2017 and 2022, forty-four counties (65.7 percent) saw increases in cover-crop acreage over the period (figure 2). Pickens County led the way with a net increase of 6,150 cover-crop acres. However, the twenty-three counties in the state (shaded blue in figure 2) that experienced disadoption between 2017 and 2022 had cover-crop acreage decrease by 63,489 acres combined. The disadoption was largest in Baldwin County, which had 23,477 fewer cover-crop acres in 2022 than in 2017. Between 2012 and 2017, Baldwin County had the largest increase in cover crop acres with a net increase of 21,617, meaning all of those cover- crop acre gains were erased.
Alabama was not alone in experiencing cover-crop disadoption after a previous period of increased adoption. Seventeen states showed an increase in cover-crop acreage from 2012 to 2017, followed by a decrease from 2017 to 2022. This presents the challenges to sustained cover-crop adoption in the state.
No-Till Use in Alabama
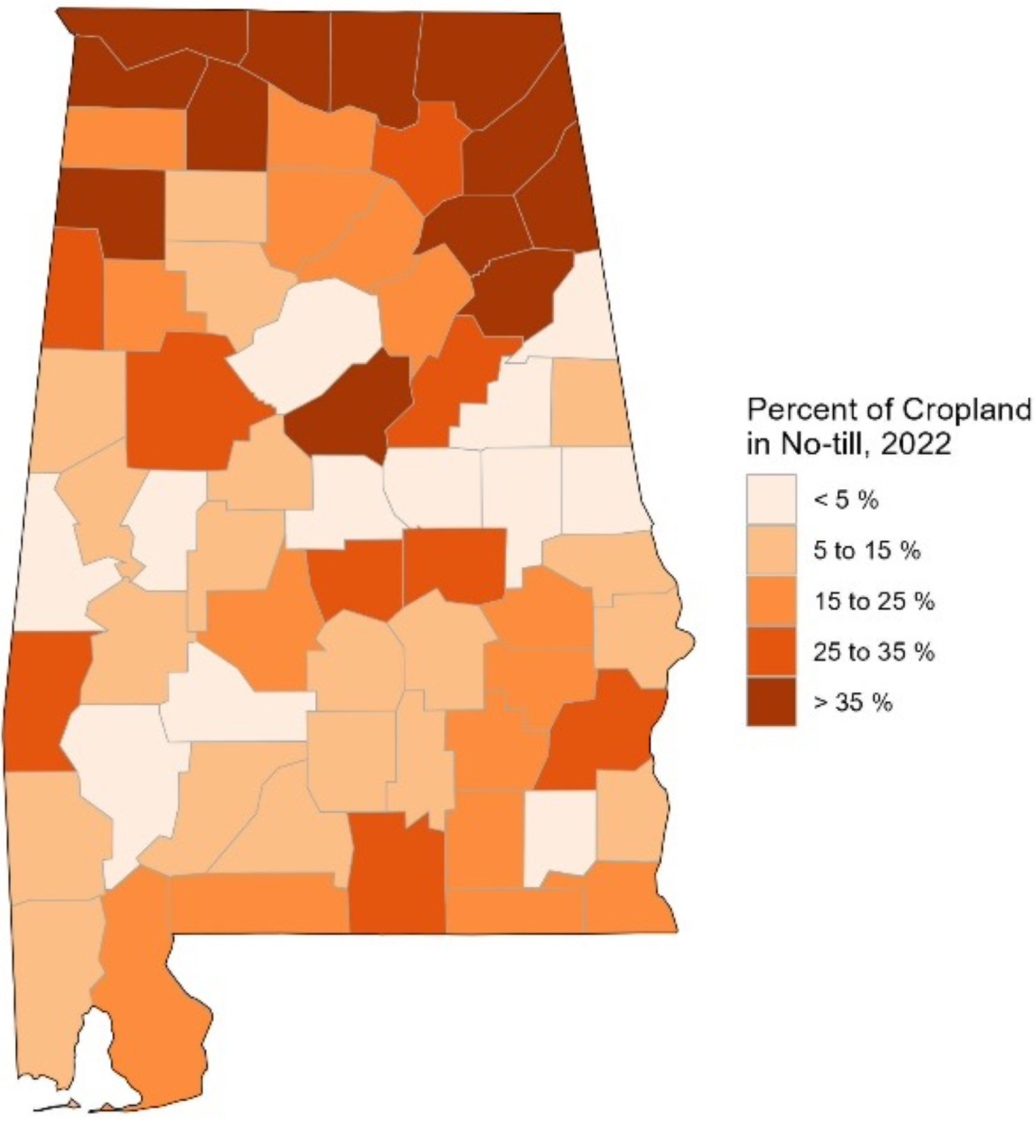
Figure 3. Percent of Alabama cropland in no-till, 2022
Alabama ranks nineteenth in the United States in percent of cropland in no-till, having the practice on 824,888 acres or 28.1 percent of the state’s cropland. No-till area is up from 27.2 percent of its cropland in 2017. Alabama is above the national no-till adoption rate of 26.4 percent. The counties with the highest rates of no-till adoption tend to be in the Tennessee Valley region of the state (figure 3). In 2022, Cherokee County maintained its lead with 67 percent of cropland being no-till, which ranks eighty-fourth nationally (out of 2,940 counties). Coosa County had the lowest adoption rate at 0.5 percent. The disparity of no-till use across the state could be due to the presence of highly erodible land and required compliance provisions for participation in United States Department of Agriculture (USDA) programs on land designated as highly erodible. No-till or other conservation tillage methods are often used to comply with these provisions.
Forty-three Alabama counties had net increases in no-till area from 2017 to 2022. The twenty-four counties that saw net decreases in no-till area had a 72,617-acre decline, combined (figure 4). This decline represents a 26.6 percent increase over the 57,338-acre decline from 2012 to 2017 no-till acreage among the counties that had net disadoption. The biggest movers between 2017 and 2022 were Jackson County, which increased by 14,953 no-till acres, and Colbert County, which had a decrease of 16,377 no-till acres.
Alabama was one of twenty-two states that saw no-till adoption increase both from 2012 to 2017 and 2017 to 2022. This is crucial because while voluntary carbon programs will likely penalize a temporary disadoption of cover crops by temporarily discontinuing the accumulation of partial carbon credits, a carbon reversal from a temporary disadoption of no-till could have much harsher consequences, ranging from losing accumulated credits to monetary sanctions.
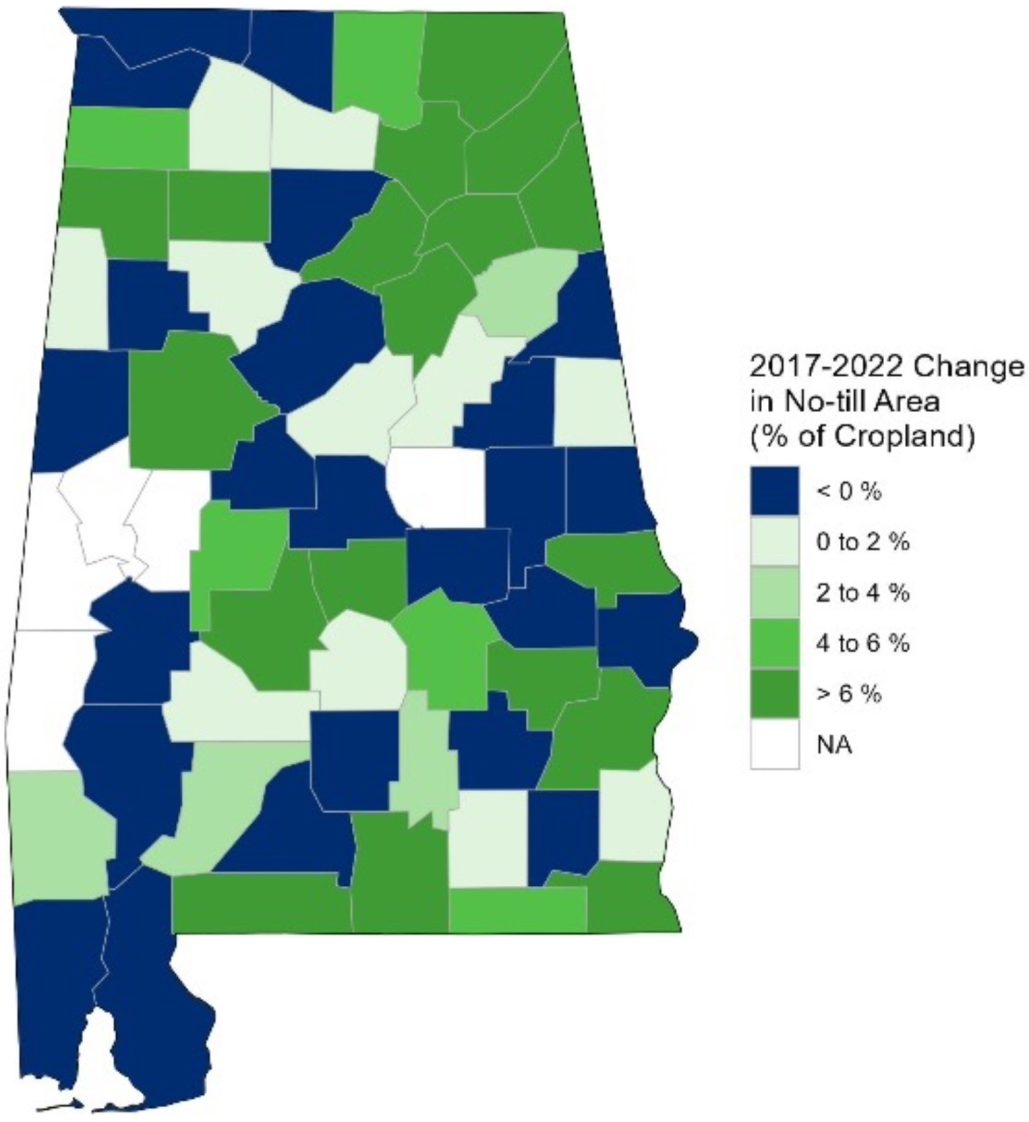
Figure 4. Change in percent of Alabama farmland in no-till from
2017 to 2022
Concluding Remarks
This publication highlights the disadoption of two conservation practices between 2017 and 2022 in Alabama. Thirty-four percent and 36 percent of the counties in the state saw disadoption of cover crops and no-till, respectively, reducing their areas in those conservation practices by 11 percent and 10 percent of their 2017 levels. If these percentages are indicative of the probability that farmers participating in voluntary carbon programs could temporarily discontinue contracted practices and trigger penalties from carbon programs, findings suggest that farmers planting cover crops and using no-till would face nontrivial probabilities of being penalized over the life of a multiyear carbon contract.
For more information about conservation practices in Alabama, visit the Healthy Soils webpage and the Down to Earth campaign on the Alabama Extension website at www.aces.edu.
References
- Plastina, A., Sawadgo, W., & Okonkwo, E. 2024. Pervasive Disadoption Substantially Offsets New Adoption of Cover Crops and No-till. Choices. Forthcoming.
- US Department of Agriculture. 2024. 2022 Census of Agriculture. Washington, DC: U.S. Department of Agriculture, National Agricultural Statistical Service.
 Wendiam Sawadgo, Extension Economist, Assistant Professor, Agronomic Crops, Auburn University; Emmanuel Okonkwo, Research Assistant, Agricultural Economics and Rural Sociology, Auburn University; and Alejandro Plastina, Associate Professor, Iowa State University
Revised June 2024, Adoption and Disadoption of Cover Crops and No-Till in Alabama 2017–2022, ANR-2891