Agronomic Crops
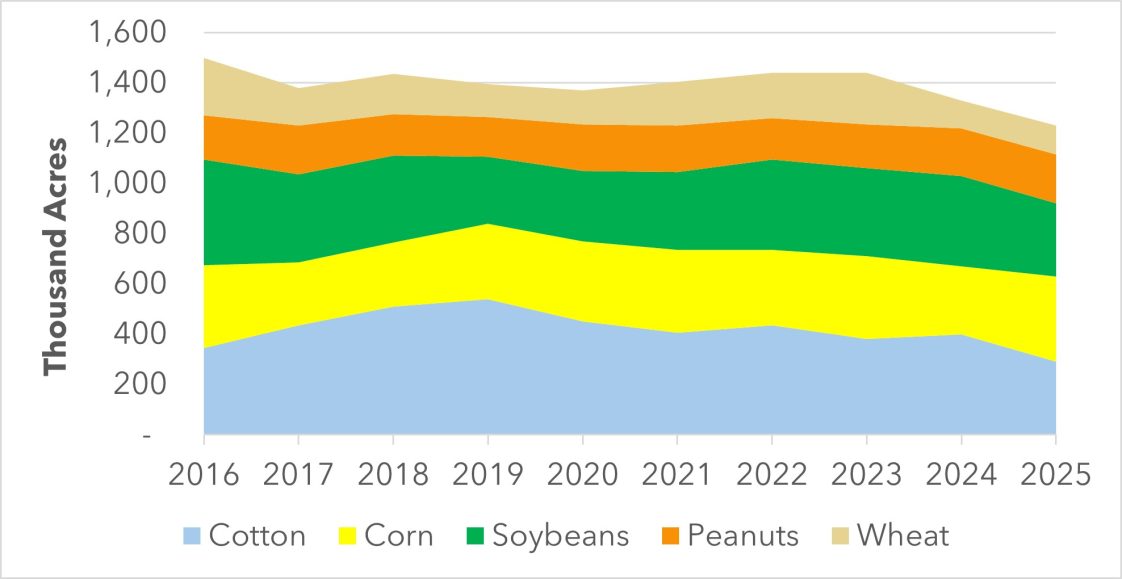
Figure 1. Alabama Planted Row-crop Area by Crop, 2016-2025
Data Source: USDA-NASS. Crop Production and Acreage reports.
Crop prices continue to remain flat in 2025, following the steep declines experienced since 2022. These recent crop price decreases occurred shortly after rapidly increasing input prices, putting pressure on profitability and placing producers in a price – cost squeeze. This article discusses how the costs to produce Alabama major row crops have changed in recent years and what this means for projected returns in 2025.
Planted Crop Area
The acreage planted to Alabama row crops has fluctuated over the past decade, as shown in Figure 1. In particular, there were significant swings in 2025. While cotton has been the crop planted to the largest number of acres over the past decade, on average, corn surpassed cotton as the top-planted crop in 2025, at 340 thousand acres. Soybean and cotton are tied for second with 290 thousand acres each. This would mark the state’s lowest cotton acreage since 2009. Peanuts had their largest planted area since 2017 with 195 thousand acres planted. Lastly, 115 thousand acres were planted to wheat.
Crop Values
The recent swings in planted crop acreage have been driven by crop price and input price changes. Declining crop prices have also had a major impact on crop values, as shown in Figure 2. Total row-crop value hit a recent peak of $1.11 billion in 2022 but then declined to $967 million in
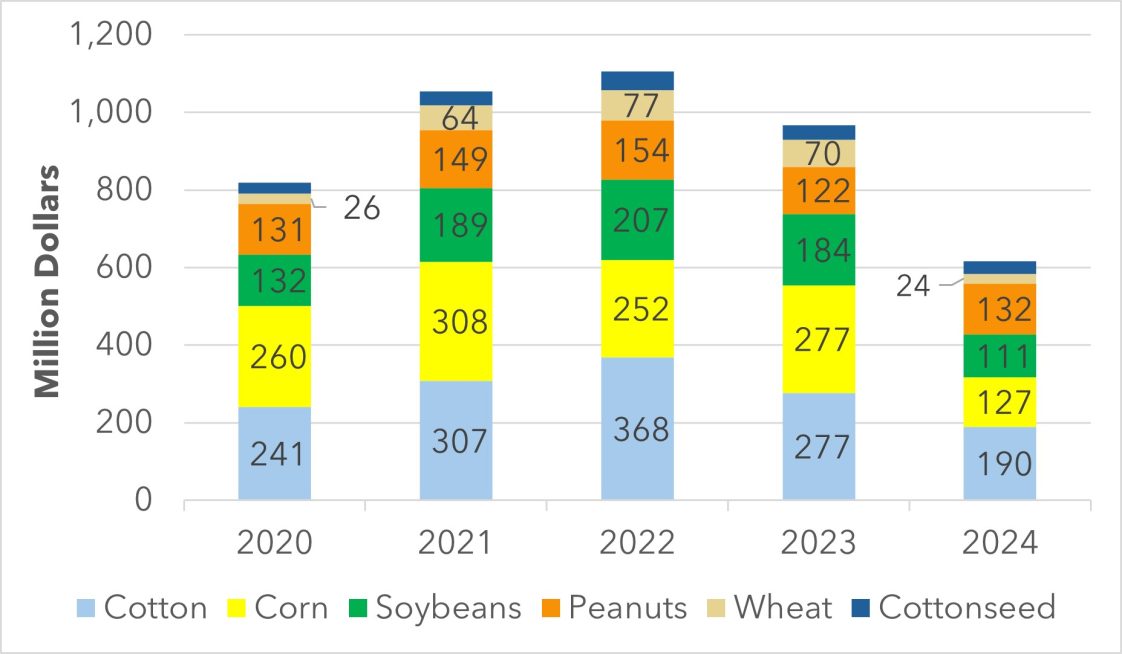
Figure 2. Alabama Value of Row-crop Production by Crop, 2020-2024. Data source: USDA-NASS. Crop Values Annual Summary
2023 and $616 million in 2024. Between 2023 and 2024, cotton value declined by 31 percent, corn by 54 percent, and soybeans by 40 percent. Only peanut value increased between 2023 and 2024. In 2025, crop values are projected to be in line with 2024 due to the similar crop prices, but the final 2025 value may change depending on this year’s crop production and prices.
Costs of Production and Net Returns
The Alabama Cooperative Extension System typically provides enterprise budgets for several row crops each year. These enterprise budgets can be used to assess how the cost to produce a crop varies year-to-year, and to estimate the projected net returns for each crop. In the following figures, the height of the orange bar represents the total cost of production (fixed cost + variable cost), the green line represents total revenue (price*production), and the blue line represents the net return over the total costs (total cost – total revenue). Please note that the total cost estimate does not include land, such as the cash rental rate for rented land or the opportunity cost of using owned land.
The total costs for non-irrigated cotton in North Alabama decreased 3 percent compared to 2024, to $832 per acre (Figure 3). The decrease in total costs was driven by lower fertilizer costs. However, cotton revenue is projected to drop 7 percent, to $595 per acre. In total, this results in a net loss of $237 per acre, excluding land costs.
Non-irrigated corn production costs decreased by 3 percent to $626 per acre (Figure 4). Similar to cotton, this was due to the decrease in fertilizer prices. Estimated total revenue decreased by 5 percent to $599 per acre, due to lower corn prices. This leaves an estimated net loss of $27 per acre, before accounting for land costs.
Total costs for non-irrigated soybeans decreased by 1 percent in 2025 compared to 2024 to $471 per acre (Figure 5). Total revenues were estimated to be the same as last year, at $473 per acre. In total, net returns are forecast to be $2 per acre, about $7 more than last year.
Peanut costs increased by 1 percent to $873 per acre due to slightly higher machinery and equipment costs (Figure 6). Total revenue expectations remain identical to last year, at $875 per acre, suggesting a net return of $2 before accounting for land costs. This represents a $7 per acre decrease from last year.
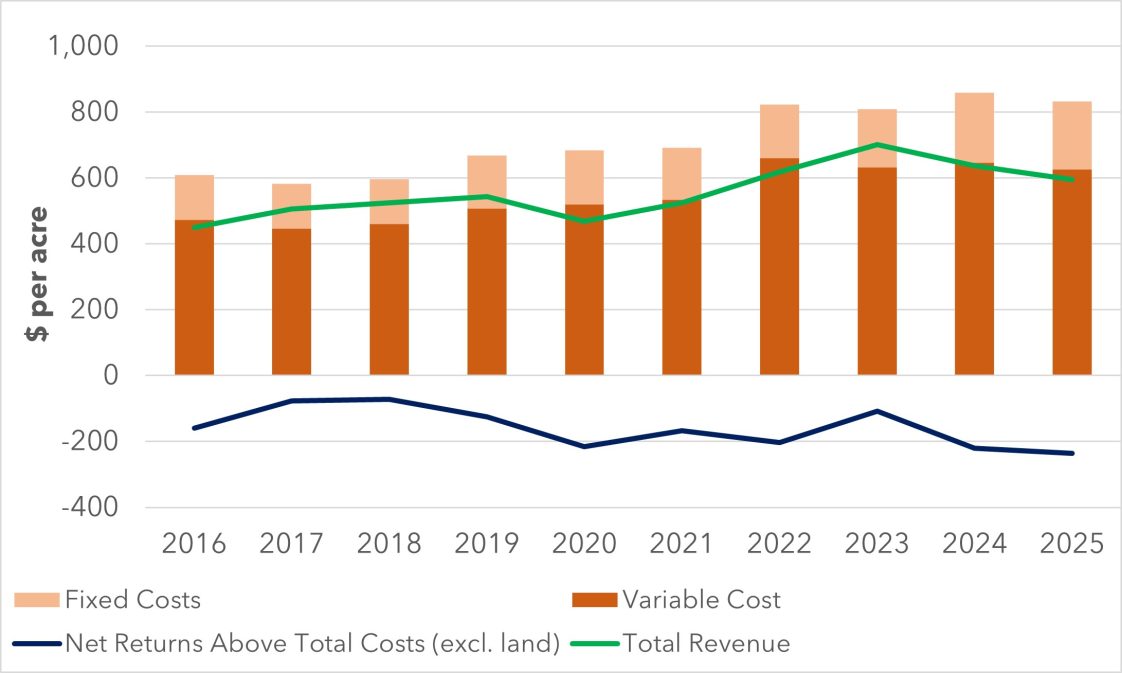
Figure 3. Alabama Dryland Cotton Costs & Returns, 2016-2025
Data source: Alabama Cooperative Extension System – Enterprise Budgets for Row Crops. Reduced Tillage Cotton – North Alabama.
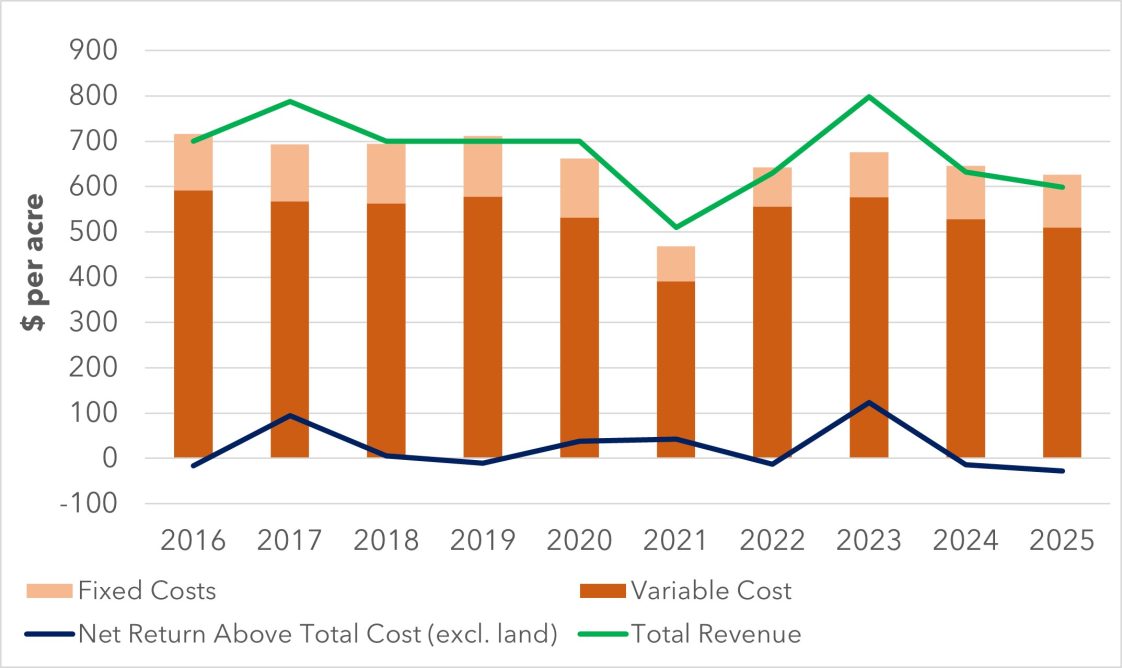
Figure 4. Alabama Dryland Corn Costs & Returns, 2016-2025
Data source: Alabama Cooperative Extension System – Enterprise Budgets for Row Crops. Reduced Tillage Corn.
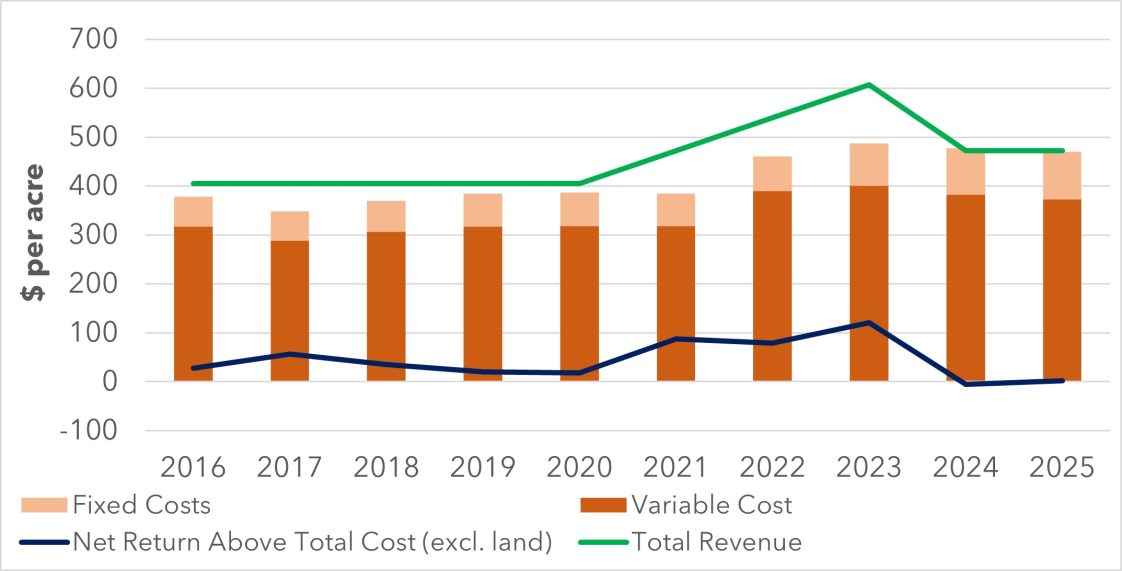
Figure 5. Alabama Dryland Soybean Costs & Returns, 2016-2025
Data source: Alabama Cooperative Extension System – Enterprise Budgets for Row Crops. Soybeans.
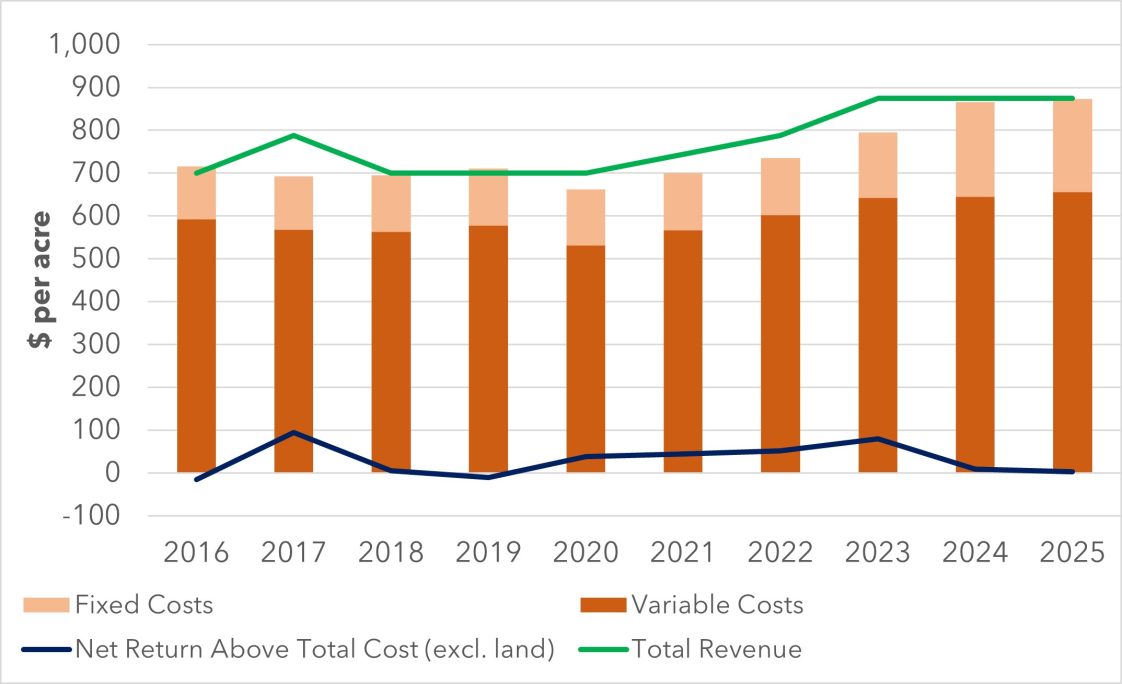
Figure 6. Alabama Dryland Peanut Costs & Returns, 2016-2025
Data source: Alabama Cooperative Extension System – Enterprise Budgets for Row Crops. Peanuts.
Conclusion
Alabama crop markets have experienced substantial changes in the past three years, leading to shifts in the number of acres planted to the various crops. Driven by reduced crop prices, total crop values declined 36 percent between 2023 and 2024. Crop profitability has declined in Alabama as well, and that is projected to continue this year. The table below shows that the expected net returns for each crop before accounting for land costs range from $2 to -$237 per acre.
Table 1: Summary of Alabama Net Returns over Total Costs (excl. land) for 2025
| Crop | Net Returns Above Total Costs Excluding Land ($/acre) |
|---|---|
| Cotton | -236.72 |
| Corn | -27.33 |
| Soybeans | 1.87 |
| Peanuts | 1.98 |
References
- Alabama Cooperative Extension System. Enterprise Budgets for Row Crops. Available at: https://www.aces.edu/blog/topics/farm-management/enterprise-budgets-for-row-crops/
- USDA-NASS. Acreage. Available at: https://usda.library.cornell.edu/concern/publications/j098zb09z
- USDA-NASS. Crop Production Annual Summary. Available at: https://usda.library.cornell.edu/concern/publications/k3569432s
- USDA-NASS. Crop Values Annual Summary. Available at: https://usda.library.cornell.edu/concern/publications/k35694332