Poultry
Learn what you will need to develop a simple nutrient management plan for your broiler facility.
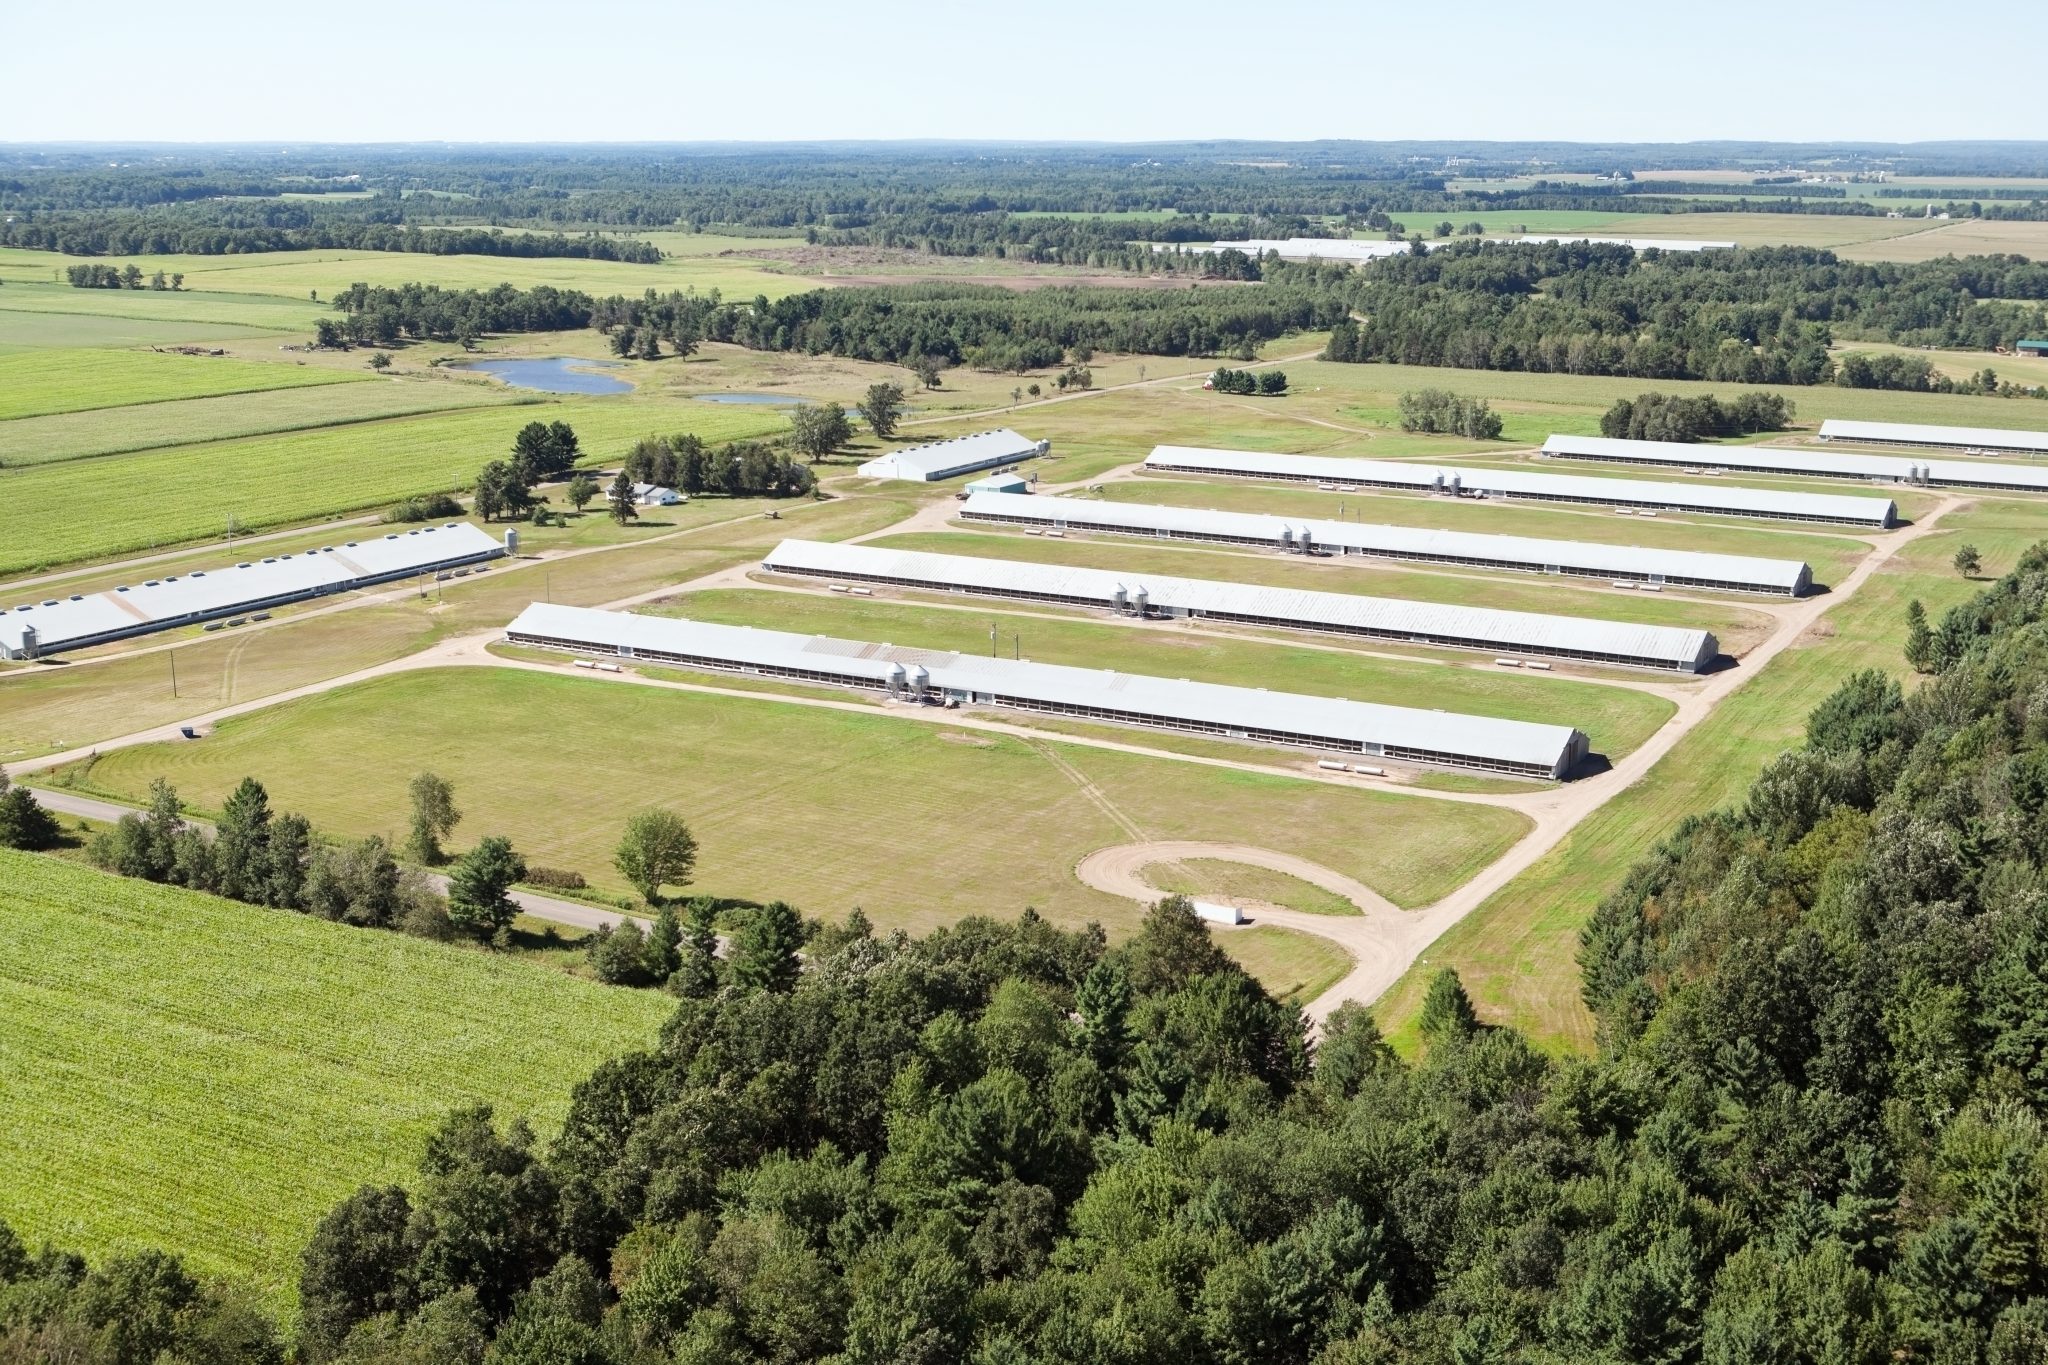
This publication provides information to help the owner/ operator of a broiler facility to develop a simple nutrient management plan. This plan should help reduce or eliminate pollutant discharge into surface and ground waters from land application of broiler litter (bedding material and manure) and dead bird compost. Once developed, this plan should be used to guide nutrient applications on all fields and crops. Although not required, the owner/operator may wish to have his or her plan reviewed and approved by a local NRCS district conservationist.
Background
Alabama’s National Pollutant Discharge Elimination System (NPDES) rules for Animal Feeding Operations (AFOs) require all AFOs to implement best management practices (BMPs) to protect water quality. While the rules for the larger Concentrated Animal Feeding Operations (CAFOs) require a registration procedure and an NRCS approved waste management system plan, all sizes of AFOs are affected.
Owners/operators of any animal feeding operation in Alabama must “ . . . maintain adequate records to document compliance . . . and regularly maintain comprehensive waste management system BMPs to the maximum extent practicable which meet or exceed NRCS technical standards and guidelines to prevent and minimize discharges of pollution during construction and operation.” (ADEM AFO/CAFO Rules adopted March 31, 1999 and reaffirmed February 10, 2006.)
A BMP common to all sizes of AFOs, a comprehensive nutrient management plan (CNMP) is one way to help meet this requirement. Nutrients of primary concern are nitrogen (N), which can leach into ground water as nitrate-N, and phosphorus (P), which can run off land and enrich surface waters. Control of these nutrients will also limit bacterial contamination of both surface and ground waters.
Things You Will Need
To proceed through the five steps of this simplified NMP, the owner/operator must have the following:
- An aerial photo or topographic map of the farm showing all fields where nutrients (either fertilizer or manure) will be applied and potentially affect streams and water bodies
- Soil survey
- Current (within last 3 years) soil test report from each field where nutrients will be applied
- Knowledge of the overall operation (for example, number of houses, number of birds produced, market weight of birds, dead bird disposal, etc.)
Five Easy Steps
The plan can be developed in five easy steps:
- Estimate broiler litter and compost production and storage.
- Estimate nutrient value of broiler litter and compost.
- Map and calculate land area for spreading, considering required buffers.
- Determine target crop and nutrient needs and timing for each field.
- Determine uses for excess litter/compost production and Certified Animal Waste Vendor needs.
Step 1. Estimate Broiler Litter and Compost Production
- First, calculate how many pounds of birds are produced on the farm each year:
lb. market wt. birds per year = no. of houses x flock size x no. of batches x pounds market wt. per bird
CAUTION: Changes in availability of wood shavings and other “new” litter material for replacement litter when houses are cleaned out could make a big difference in the amount of “litter” produced each year by any particular farm. Use actual figures for litter produced from each farm if at all possible.
About 0.5 pound of broiler litter will be produced for each pound of market weight bird produced (based on tests by Auburn University Biosystems Engineering and the Alabama Poultry Industry). Therefore, use the following to estimate pounds of litter produced per year on a farm:
lb. manure per year = lb. market wt. birds per year x 0.5
Example:
Ima B. Goode has 4 broiler houses that hold 28,000 birds each. She markets 4.5-pound birds and produces 6 flocks a year. How much litter can she expect to produce on this farm each year?
Market wt. birds:
4 houses x 28,000 birds/hse x 6 batches/yr. x 4.5 lb./bird = 3,024,000 pounds or 1,512 tons market wt. birds
Litter produced:
1,512 tons x 0.5 = 756 tons litter per year (Ms. Goode, like most producers, will probably need to plan to store up to half of this or about 380 tons.)
- Determine dead bird compost produced. (Skip this section if birds are incinerated or taken to a rendering plant.)
Estimate the weight of dead birds that need to be composted each year (Table 1). The amount of litter needed in this composting process is estimated by multiplying the weight of dead birds by 2.5. During the composting process, assume about 20 percent weight loss.
Example:
Ima B. Goode assumes that the average size of her dead birds is 2.1 pounds (Table 1), and she expects about 5 percent mortality.
Dead bird weight: 4 houses x 28,000 birds/hse x 6 batches/yr. x 0.05 mortality x 2.1 lb./bird = 70,560 pounds dead birds or 35.28 tons
Litter needed to compost dead birds (from Worksheet 1):
35.28 tons x 2.5 = 88.2 tons
(This can be subtracted from the total litter produced.)
Total compost produced:
(35.28 tons dead birds + 88.2 tons litter needed) x 0. 80 residual = 99 tons compost
- Determine litter and compost storage:
Adequate dry stack or temporary storage must be provided to store and/or spread litter according to this plan. State this as part of the nutrient management plan.
Minicomposters (single stage) may have no storage capacity beyond one flock. Determine your compost storage capacity needs to properly time application of generated compost on a growing crop. Dead bird compost should be stored separately from normal broiler litter.
NOTE: Before spreading any litter, always plan to use the dead bird compost on the farm where it was generated. Dead bird compost cannot be transported without a special permit from the state veterinarian’s office of the Alabama Department of Agriculture and Industries. Spreading of the litter at the proper time recommended for the crop to be grown and at the rate recommended is a best management practice.
Example:
Ms. Goode’s NRCS-designed two-stage composters will store 3 batches of compost or half of the 99 tons generated in a year.
Step 2. Estimate Nutrient Value of Broiler Litter and Compost
For the purposes of nutrient management planning, average values for litter and composted dead birds can be used from Table 1. These values are estimates of plant available nutrients during the first year under Alabama conditions. As a general rule, poultry broiler litter is a 3-3-2 fertilizer (60-60-40 pounds N-P2O5-K2O per ton), but not all the N in broiler litter is available to crops. Since manure and compost are highly variable, they should be periodically tested to verify the actual nutrient value. Analyzed values are preferable to values from a table. If actual litter production is used in Step 1 rather than an estimated value, then actual laboratory analyses of the litter should be used in Step 2. Keep laboratory analyses as part of this plan.
Example:
From Table 1, Ima B. Goode estimates that her litter contains 56-58-45 pounds N-P2O5-K2O per ton if incorporated. The dead bird compost contains 50-58-45 pounds N-P2O5-K2O per ton. But since she will surface apply all litter to pastures and hayfields, she can multiply the N value by 0.84 to account for N volatilization.
Available nutrients of surface-applied litter = 47-58-45 per ton
Available nutrients of surface-applied compost = 42-58-45 per ton
Step 3. Map and Calculate Land Area for Spreading
To identify fields for litter and compost spreading and to calculate spreadable acreage, you will need a detailed farm map to scale. This can be a copy of your conservation plan map or a soil survey map of the farm from NRCS, a Farm Service Agency (FSA) aerial photo of the fields, or a sketch you draw yourself. A topographic map of the farm can help identify steep slopes and waterways. Some maps such as digital ortho quarter quadrangles or DOQQs can be downloaded from various websites.
On the field map show the following:
- Field identification (name or number)
- Spreadable acreage (total acreage minus buffers, borders, waterways, riparian zones, frequently flooded soils, etc.) (Table 2).
- All streams and ditches
- Wells, springs, and ponds
- Roads, forestland, and other areas impractical for spreading
- Houses, barns, and other buildings
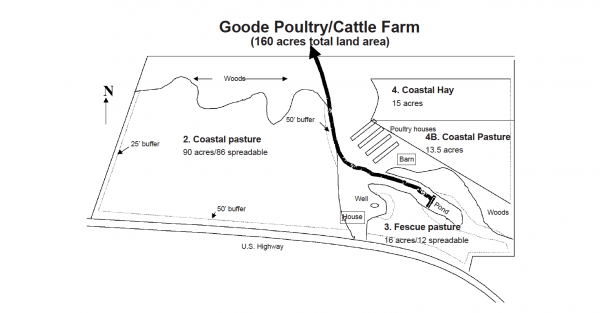
Map of 160-acre poultry and cattle farm
Spreadable or useable acres in a field can be estimated if you know the scale of the map.
Rectangle or square field: (length in feet x width in feet)/43,560 = acres
Triangle-shaped field: 1⁄2 (length in feet x width in feet)/43,560 = acres
Round field: (3.14 x radius x radius)/43,560 = acres
Irregular-shaped fields: estimate area in field
Another way of arriving at spreadable acres is to figure the border/buffer area removed from use and subtract this from the FSA-figured field acres.
Step 4. Determine Crop and Nutrient Needs for Each Field
Soil samples should be taken from each field (no more than 10 acres per composite sample) at least every 3 years. Samples should be taken from the surface 0 to 3 inches from pastures and hayfields and the plow layer for cultivated cropland. Keep these reports as part of your nutrient management plan. Soil testing is a BMP! Failure to soil test could justify redesignating an AFO into a CAFO by ADEM.
Apply manures in fall and winter only to actively growing crops. In North Alabama (see Alabama map) from approximately November 15 to February 15, apply no more than 30 pounds of nitrogen per acre to the crops as indicated in Table 3 if the crop meets the minimum grazing height requirements of NRCS conservation practice standard, Prescribed Grazing-528A.

Map indicating northern and southern portions of the state of Alabama
Nutrients (fertilizer or manure) can be applied based on two options and modified based on the phosphorus index (P index), which can be calculated for each field: (1) nitrogen limit based on soil test recommendations from Auburn University’s Soil Testing Laboratory and (2) anticipated crop P removal.
Option 1. Nitrogen Limit
If phosphorus (P) is needed and recommended, then applying P at the recommended rate is the best option (soil test P rating is “very low,” “low,” “medium,” and sometimes “high”). If allowed by the P index (see below) litter or compost may be applied based on the N recommended for the crop to be grown. In most cases, this will result in more P applied than is needed or recommended, but this will be apparent in the next soil sample taken because soil test P will build rapidly.
Option 2. P Crop Removal
If soil test P is already rated “high” (H), “very high” (VH), or “extremely high” (EH), then no more P is needed for maximum crop yields. However, since some crops, particularly hay and silage, can remove significant quantities of P, application based on crop removal (Table 3) is allowed. Additional fertilizer N and/or K may be needed for optimum crop production. NOTE: Animals grazing pastures remove very few nutrients; this may limit application of litter on pastures.
P Index
Phosphorus application in excess of P recommended by soil test shall be based on the field vulnerability for offsite P losses to surface waters. This potential is estimated by calculating a P index for every field (see USDA-NRCS publication Phosphorus Index for Alabama). The P index is a way of assessing the potential for soil and applied P to run off into surface waters. A low P index is desirable and may allow higher P applications to some soils. Best management practices, such as grassed waterways, setbacks from streams, filter strips, limited animal access to surface waters, and lower P applications can decrease the P index. In some cases where soil test P is rated “EH,” a low P index may still allow for some litter or compost application. The planned P rate cannot exceed the P application rate used in calculating the P index.
The NPDES AFO rules require the AFO operator to maintain detailed records of all land application of animal/broiler wastes. This includes date of application, weight and/or volume, destination, and acreage spread.
These records should easily allow determination of spread rate in each field.

Chart of P index rating (Field vulnerability)
Step 5. Determine Uses for Excess Litter/Compost Production
From these calculations, you will now be able to determine if your present operation can effectively use all the waste nutrients in an environmentally sound manner. Based on step 4, determine how much litter or compost can be reasonably applied to each field and when it should be applied. Animal wastes should only be applied when there is an actively growing crop or when it is less than 1 month before planting a crop. This is also a BMP. If cleanout of houses does not correspond with the proper time to apply to crops, then storage facilities (e.g., dry stack barns or temporary, covered stacks) may have to be constructed.
If more litter is produced than can be used on the farm based on step 4, it should be consigned to an Alabama Certified Animal Waste Vendor (CAWV). If you use a CAWV, include his or her name in the nutrient/waste management plan if possible. The owner/operator is responsible, to the extent allowed by law, for the proper use of any excess litter that is not consigned to a CAWV even if it is sold or given to a neighbor or spread on someone else’s land. Any sale of litter should be accompanied with information on proper use of the litter and be fully documented with a record of the transaction.
Worksheets
The following worksheets may be used in preparing the nutrient/ waste management plan, or the owner/operator can develop his or her own worksheet. The important point is to plan the use of all nutrients/waste produced on the farm.
Table 1. Characteristics of Poultry Operations and Waste Generated
| Category | Bird Weight (lb.) | No. of Flocks Per Year | Mortality Rate (%) | Available Nutrients in Manure + Litter (Pounds Per Ton) N1 | Available Nutrients in Manure + Litter (Pounds Per Ton) P205 | Available Nutrients in Manure + Litter (Pounds Per Ton) K2O |
|---|---|---|---|---|---|---|
| Broiler | 2.1 (average) 4.5 (mature) | 6 | 4 | 56 | 58 | 45 |
| Broiler | 3.2 (average) 6.5 (mature) | 5.5 | 7.5 | 56 | 58 | 45 |
| Broiler (roaster) | 4.2 (average) 8.5 (mature) | 4.5 | 6 | 56 | 58 | 45 |
| Cornish hen | 1.0 (average) 2.0 (mature) | 9 | 3.5 | 56 | 58 | 45 |
| Pullets breeder replacement | 4.0 (average) 4.5 (mature) | 2.2 | 4 | 29 | 57 | 35 |
| Pullets layer replacement | 2.0 (average) 3.0 (mature) | 2 | 2 | 27 | 57 | 35 |
| Breeding hens & roosters | 6.0 (average) 7.5 (mature) | 0.8 | 11 | 32 | 53 | 35 |
| Laying hen | 4.0 (average) 4.5 (mature) | 0.8 | 14 | 31 | 57 | 56 |
| Dead bird compost | 50 | 58 | 45 |
1 Values for N are for soil-incorporated manure. Multiply N values by 0.84 if surface applied and not incorporated within 3 days to account for N volatilization losses.
NOTE: 1 cubic yard litter = 810 pounds 1 ton = 2.5 cubic yards
(Highly moisture dependent. Use actual values for each farm, if available.)
Table 2. Recommended Buffer Widths for Animal Manure and Organic By-Product Application
| Object, site | Situation | Buffer width (ft.) from object or site |
|---|---|---|
| Well | Located up-gradient of application site | 200 |
| Well | Located down-gradient of application site | 300 |
| Water body or stream1 | Waste applied to pasture3 or hayland or cultivated land 4 | 502 |
| Public road | Spray irrigated wastewater | 100 |
| Public road | Waste applied with spreader truck | 50 |
| Public use area5 | Dry waste | 100 |
| Liquid waste | 200 | |
| Spray irrigated wastewater | 500 | |
| Property line | All | 25 |
1 Water body includes pond, lake, wetland, or sinkhole. Stream includes both perennial and intermittent streams.
2 200’ for Outstanding National Resources Water or Outstanding Alabama Water. On edges of the application field where runoff occurs to environmentally sensitive areas and to nonvegetated concentrated flow areas within the field, buffer widths must include a vegetated filter at least 50 feet wide that is established to permanent grasses (filter strip) with a stem density of at least 1 per square inch. If the filter incorporates a riparian forest buffer, in accordance with NRCS Conservation Practice Standard, Riparian Forest Buffer – Code 391A, the permanent grass filter strip may be 20 feet wide. The vegetated width must be located adjacent to the application field or concentrated flow area and be shaped so that flow from runoff is uniform (sheet flow) and does not concentrate.
3 If good grazing management (i.e., rotational grazing) is not used on pasture land, the vegetative filter must be protected from overgrazing
with a fence.
4 Cultivated land for waste application must have adequate erosion control practices in place.
5 Public areas include such occupied locations as a nonowner dwelling, church, hospital, or park.
Table 3. Nutrient Removal by Selected Crops
| Crop | Unit yield | Nutrient removal N | Nutrient removal P2O5 | Nutrient removal K2O |
|---|---|---|---|---|
| Alfalfa hay | 1 ton | 52 | 12 | 50 |
| Bahiagrass hay | 1 ton | 25 | 7 | 42 |
| Bermudagrass hay | 1 ton | 50 | 12 | 43 |
| Clover hay | 1 ton | 40 | 10 | 40 |
| Corn grain | 1 bushel | 1 | 0.4 | 0.3 |
| Corn silage | 1 wet ton | 10 | 4 | 10 |
| Cotton lint and seed | 1 bale | 32 | 12 | 16 |
| Oats (grain only) | 1 bushel | 0.8 | 0.3 | 0.2 |
| Oats and grain and straw | 1 bushel | 1.2 | 0.4 | 1.4 |
| Pasture (bermuda or bahia) | 300 lb. beef | 6 | 5 | 1 |
| Pasture (fescue, ryegrass, orchardgrass) | 300 lb. beef | 9 | 7 | 1 |
| Peanuts and nuts | 1 ton | 70 | 11 | 16 |
| Peanuts and nuts and vines | 1 ton nuts + vines | 120 | 15 | 93 |
| Peas and vines and pods | 1 ton | 48 | 12 | 25 |
| Ryegrass hay | 1 ton | 33 | 5 | 28 |
| Sweetpotatoes | 100 bushels | 13 | 6 | 32 |
| White potatoes | 100 pounds | 0.3 | 0.2 | 0.5 |
| Sorghum (grain) | 1 bushel | 0.8 | 0.4 | 0.2 |
| Sorghum (silage) | 1 wet ton | 11 | 4 | 10 |
| Soybean (grain) | 1 bushel | 4 | 1 | 1.5 |
| Switchgrass hay | 1 ton | 23 | 6 | 46 |
| Tall fescue hay | 1 ton | 40 | 9 | 48 |
| Tomatoes (fruit) | 100 pounds | 4 | 1 | 9 |
| Wheat (grain) | 1 bushel | 1.2 | 0.6 | 0.3 |
| Wheat or grain or straw | 1 bushel | 1.7 | 0.7 | 2 |
Source: Alabama Cooperative Extension publication ANR-0449, “Nutrient Removal by Alabama Crops,” and USDA-NRCS, AL Nutrient Management Code 590
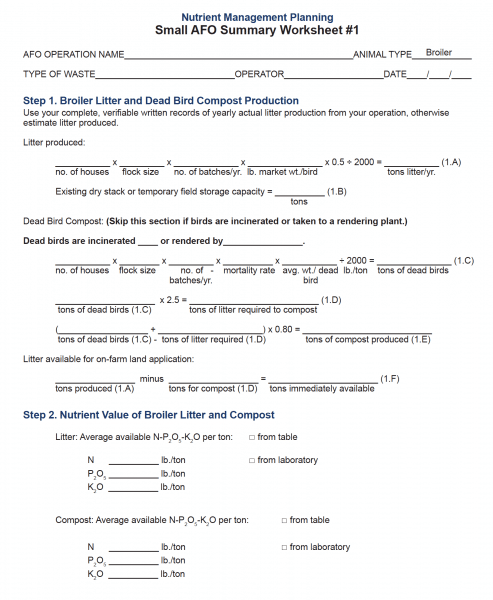
Example of a Nutrient Management Planning Small AFO Summary (Worksheet # 1)
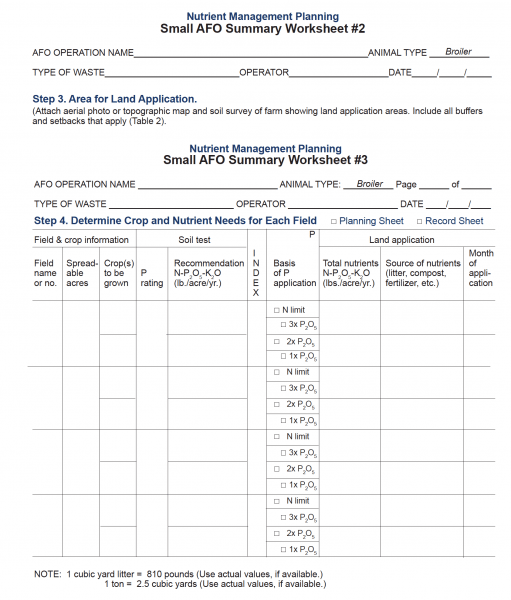
Examples of a Nutrient Management Planning Small AFO Summary (Worksheets # 2 and # 3)
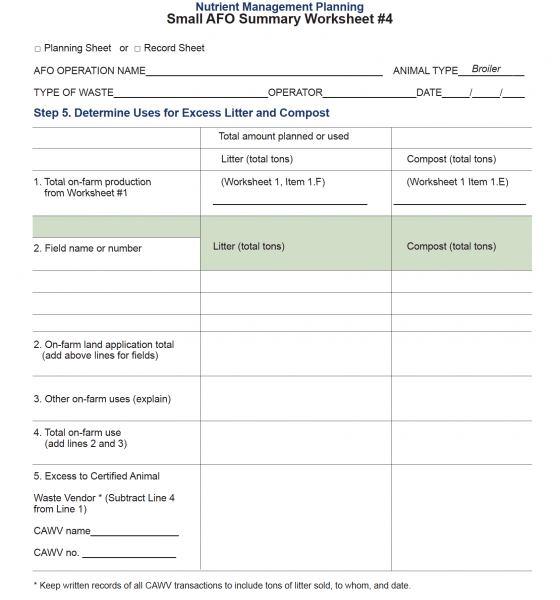
Examples of a Nutrient Management Planning Small AFO Summary (Worksheet # 4)
Download a PDF of Nutrient Management Planning for Broiler AFOs, ANR-0926.