Forestry
Understanding the cost of forestry practices helps forest landowners and managers with financial planning, budgeting decisions, and evaluating profitability and returns. Furthermore, in forest management decision-making, understanding the costs of forestry practices helps inform decisions about project feasibility and identify cost drivers.
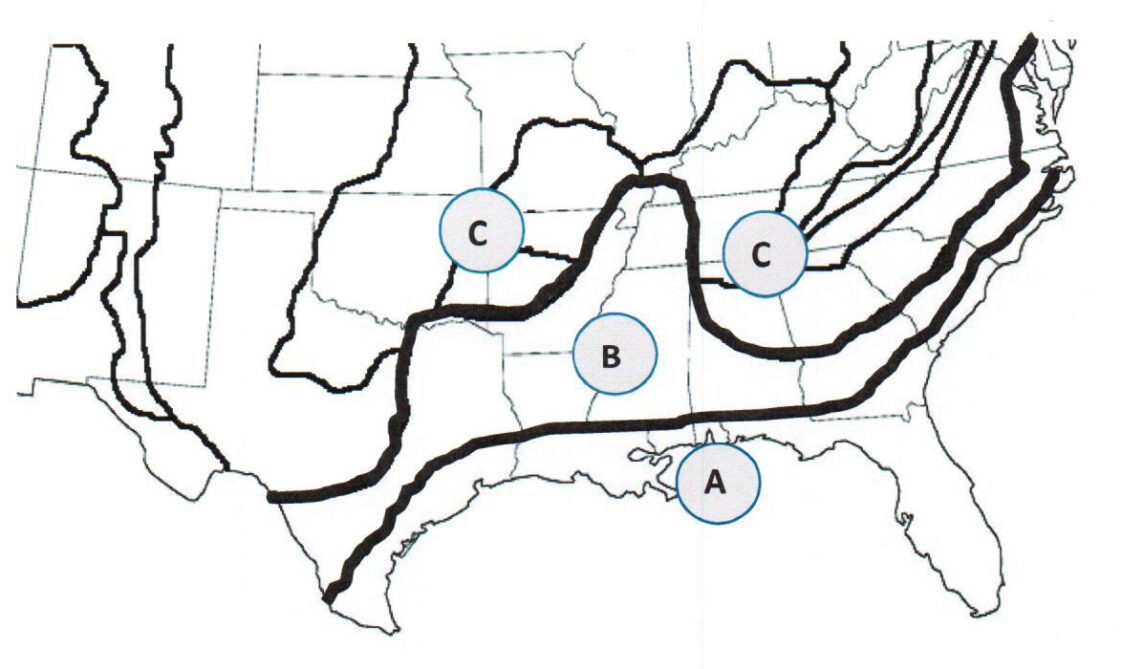
Figure 1. Physiological regions in the South that was used in the 2024 Cost of Forestry Practices survey showing the Southern Coastal Plain (A), Northern Coastal Plain (B), and Piedmont or similar uplands (C).
The Cost of Forestry Practices survey began in the South in 1952 and has been conducted periodically. Since 1982, the survey has been taken every 2 years. This document summarizes the results of a 2024 survey examining the costs of forestry practices across the southern United States. For this survey, three physiographic regions in the South were considered: the Southern Coastal Plain, Northern Coastal Plain, and Piedmont regions (figure 1). The online survey was distributed through various outlets across 14 states in the southern region. From that distribution, 215 responses were recorded, and 167 were usable, resulting in a 77.7 percent completion rate.
Of the usable responses, 73 percent were from private family landowners, 14 percent from consulting firms, 6 percent from private nonindustrial entities, 3 percent from publicly funded nonindustrial organizations, 3 percent from industrial landowners, and 1 percent from public agencies managing public lands. Further, not enough responses were received to present results for timber marking and precommercial thinning operations.
Results
Mechanical Site Preparation
Mechanical site preparation was reported on 10,384 acres at an average cost of $159.82 per acre (table 1) and included 22 percent of the survey respondents. Reported practices included bedding, drum chopping, and ripping or subsoiling treatments. Bedding treatments averaged $163.36 per acre, while drum chopping averaged $107.00 per acre. Not enough responses were received to report double-pass or triple-pass operations.
Table 1. Mechanical Site Preparation Costs Per Acre
| Site Preparation Treatment | Number of Passes | Acres | Southern Coastal Plain Average Cost Per Acre | Northern Coastal Plain Average Cost Per Acre | Piedmont Average Cost Per Acre | Overall Average Cost Per Acre |
|---|---|---|---|---|---|---|
| Bedding, all types | 1 | 3,738 | * | * | * | 160.71 |
| Bedding, all types | All | 5,047 | 156.50 | * | * | 163.36 |
| Drum chopping | 1 | 1,181 | 107.00 | * | * | 107.00 |
| Rip/subsoil | All | 9,541 | * | * | * | 106.67 |
| All | All | 10,384 | 167.60 | 188.99 | * | 159.82 |
Planting
In 2024, a total of 27,795 acres were planted to pine seedlings across all methods. Hand planting accounted for 15,975 acres, while machine planting accounted for 11,820 acres (table 2) and included 66 percent of the survey respondents. Most of the pine seedlings planted were bare-root loblolly pine (Pinus taeda), which made up 61 percent of the total acres reported. Pine seedlings planted averaged 611 per acre—608 for hand planting and 614 for machine planting (table 2). Overall, the cost per seedling to plant by hand is 26 percent less than the cost per seedling to plant by machine.
Table 2. Hand and Machine Planting Costs Per Acre and Cost Per Seedling to Plant
* Too few responses; overall planting costs per acre includes seedling costs and oversight.
| Planting Method | Acres | Southern Coastal Plain Average Cost Per Acre | Northern Coastal Plain Average Cost Per Acre | Piedmont Average Cost Per Acre | Overall Average Planting Cost Per Acre | Cost Per Seedling to Plant | Cost Per Seedling to Purchase | Overall Average Seedlings Per Acre |
|---|---|---|---|---|---|---|---|---|
| Hand Planting | ||||||||
| Cutover land, loblolly pine, bareroot | 6,860 | * | 142.22 | * | 134.88 | 0.11 | 0.13 | 562 |
| Cutover land, loblolly pine, container | 2,083 | * | * | * | 146.45 | 0.14 | 0.15 | 505 |
| Cutover land, longleaf pine, container | 5,061 | 210.56 | 224.00 | * | 216.92 | 0.13 | 0.21 | 638 |
| Cutover land, all pine, container | 8,833 | 195.30 | 216.58 | * | 203.94 | 0.13 | 0.20 | 618 |
| All hand methods, all pine | 15,975 | 183.90 | 208.23 | 187.20 | 200.64 | 0.14 | 0.19 | 608 |
| Machine Planting | ||||||||
| Cutover land, all pine, bareroot | 10,917 | 142.22 | 216.00 | * | 178.06 | 0.18 | 0.11 | 614 |
| Cutover land, loblolly pine, bareroot | 10,089 | * | 216.00 | * | 179.51 | 0.18 | 0.11 | 619 |
| All land, all pines, bareroot | 11,467 | 142.22 | 207.68 | * | 176.03 | 0.18 | 0.11 | 607 |
| All machine methods, all pine | 11,820 | 198.90 | 207.68 | * | 190.34 | 0.19 | 0.12 | 614 |
Prescribed Burning
Forty-six percent of survey respondents reported prescribed burning costs for 2024. A ground drip torch was used in all cases for a total of 101,272 acres at an overall average cost of $37.78 per acre (table 3). Burning purposes included site preparation and fuel reduction. The cost per acre for prescribed burning used for site preparation was 23 percent higher than the cost of prescribed burning for fuel reduction purposes. Regional differences in costs were reported. In general, prescribed burning practices reported in the Piedmont region were more expensive, followed by the Northern Coastal Plain, and then the Southern Coastal Plain.
Table 3. Prescribed Burning Treatment Costs Per Acre by Ignition Type and Burning Purpose
| Ignition Type | Burning purpose | Acres | Southern Coastal Plain Average Cost Per Acre | Northern Coastal Plain Average Cost Per Acre | Piedmont Average Cost Per Acre | Overall Average Cost Per Acre |
|---|---|---|---|---|---|---|
| Ground | Site preparation | 17,465 | 40.25 | 40.09 | 43.57 | 40.72 |
| Ground | Fuel reduction | 83,502 | 24.60 | 34.92 | 37.54 | 33.13 |
| Ground | All | 101,272 | 31.56 | 38.90 | 40.18 | 37.78 |
Chemical Application
Chemical applications were reported by 74 percent of respondents who treated 318,524 acres in 2024 (table 4). Site preparation, invasive plant control, and herbaceous weed control were the primary treatment purposes, with most acres (55 percent) treated as part of herbaceous weed control activities. Sixty-five percent of the acres reported were treated by aerial application. Overall, aerial application methods and ground application methods were similar in cost.
Table 4. Chemical Application Costs Per Acre by Treatment Purpose and Method of Application
| Treatment Purpose | Method of Application | Acres | Southern Coastal Plain Average Cost Per Acre | Northern Coastal Plain Average Cost Per Acre | Piedmont Average Cost Per Acre | Overall Average Cost Per Acre |
|---|---|---|---|---|---|---|
| Site preparation | Ground | 17,664 | 107.87 | 119.25 | 89.25 | 105.35 |
| Site preparation | Aerial | 34,532 | 96.86 | 114.63 | * | 109.62 |
| Site preparation | All | 54,027 | 104.63 | 110.67 | 90.63 | 106.07 |
| Invasive plant control | All | 3,039 | * | * | 122.00 | 98.13 |
| Herbaceous weed control | Aerial | 173,058 | * | 53.90 | * | 62.62 |
| Herbaceous weed control | All | 173,621 | * | 59.64 | * | 66.77 |
| All | All | 318,524 | 117.27 | 99.03 | 88.50 | 101.70 |
Fertilization
Eight percent of respondents reported using fertilizer as a forestry practice in 2024. Those who reported the use of fertilizer treated a total of 11,205 acres at an average cost of $114.22 per acre (table 5). Eighty-seven percent of acres reported used ground application of fertilizer.
Table 5. Fertilization Costs Per Acre by Purpose of Application, Application Method, and Fertilizer Type
* Too few responses
| Purpose of Application | Application Method | Fertilizer Type | Acres | Southern Coastal Plain Average Cost Per Acre | Northern Coastal Plain Average Cost Per Acre | Piedmont Average Cost Per Acre | Overall Average Cost Per Acre |
|---|---|---|---|---|---|---|---|
| Stand establishment | All | All | 5,726 | 124.50 | * | * | 118.60 |
| All | Ground | All | 9,719 | * | * | * | 125.60 |
| All | All | All | 11,205 | 124.67 | * | * | 114.22 |
Timber Cruising
Timber cruising was reported by 31 percent of survey respondents in 2024 for a total of 104,110 acres (table 6). Fifty-three percent of the acres reported used the fixed area plot sampling method. Variable radius plot sampling method was approximately 35 percent less expensive than the fixed area plot sampling method on a per-acre basis.
Table 6. Timber Cruising Costs by Inventory Purpose and Method Used
* Too few responses
| Inventory Purpose | Species | Method Used | Acres | Southern Coastal Plain Average Cost Per Plot | Northern Coastal Plain Average Cost Per Plot | Piedmont Average Cost Per Plot | Overall Average Cost Per Plot | Overall Average Cost Per Acre |
|---|---|---|---|---|---|---|---|---|
| Timber sale | All | Fixed area plot | 46,730 | * | * | * | 11.17 | 10.50 |
| Timber sale | All | All | 46,980 | * | * | * | 11.11 | 10.44 |
| All | All pine | Fixed area plot | 54,891 | * | 12.33 | * | 13.42 | 11.41 |
| All | All pine | All | 101,395 | 19.40 | 14.86 | * | 16.90 | 12.17 |
| All | All | Fixed area plot | 55,104 | 19.75 | 20.11 | * | 16.54 | 12.24 |
| All | All | Variable radius plot | 48,954 | * | * | * | 17.02 | 8.00 |
| All | All | All | 104,110 | 16.30 | 16.65 | 18.53 | 17.15 | 12.35 |
Custodial Management
Custodial management costs may include activities such as road construction and maintenance, boundary line maintenance or surveys, insect and disease management, property taxes, fire protection activities, or legal fees. For 2024, 31 percent of respondents reported custodial management activities (table 7). Due to updates to the survey regarding this question, many operation types and units of cost were reported. Average cost per unit for each operation type is listed in table 7.
Table 7. Custodial Management Costs by Operation Type
* Too few responses
| Operation Type | Unit of Cost | Total Units | Southern Coastal Plain Average Cost Per Unit | Northern Coastal Plain Average Cost Per Unit | Piedmont Average Cost Per Unit | Overall Average Cost Per Unit |
|---|---|---|---|---|---|---|
| Installing fire lines | Acres | 25,552 | * | 41.67 | 26.29 | 34.86 |
| Maintaining fire lines | Acres | 1,106 | * | * | * | 40.52 |
| Wildlife management | Acres | 907 | * | * | * | 224.88 |
| Property taxes | Acres | 55,538 | * | 9.25 | * | 8.18 |
| Installing fire lines | Miles | 10,509 | * | * | * | 240.83 |
| Maintaining fire lines | Miles | 225 | * | * | 481.92 | 348.60 |
| Road maintenance | Miles | 378 | * | * | * | 632.25 |
| Installing fire lines | Hours | 1,003 | * | 121.33 | * | 121.33 |

Figure 2. Percent change in the average cost of forestry practices from 2022 to 2024.
Changes in Cost Estimates
Compared to the 2022 survey results, costs of forestry practices generally increased across most categories except for mechanical site preparation, which decreased by 7.5 percent (figure 2). However, the acres reported for mechanical site preparation decreased by 89.6 percent in 2024. The largest cost increase from 2022 to 2024 was observed for timber cruising (35.4 percent) (figure 2). Similar to survey results of recent years, fertilization was the practice with the lowest response rate by participants. Precommercial thinning and tree marking received too few responses to report in 2024. Participants in the 2024 survey (167) were fewer compared to 2022 (254), with fewer overall acres reported for most practices. Overall, the 2024 results show a continued upward trend in forestry practice costs, particularly for timber cruising, fertilization, and planting activities, reflecting ongoing increases in labor, equipment, and operational expenses.
New Online Dashboard
In collaboration with the Forest Landowner Foundation, a new online dashboard was developed for the costs and trends of southern forestry practices (figure 3). The online dashboard premiered with the results of the 2022 survey in the fall of 2023. The online and interactive platform provides a comprehensive, data-driven experience to meet the needs of forest landowners, land managers, researchers, policymakers, and other forest enthusiasts seeking this valuable dataset. The platform offers a report of the 2024 Cost of Southern Forest Practices Survey, which is presented across various tabs, where you can explore regional bar charts and color-coded maps, bar charts, and tables summarizing the average weighted cost per acre of various forest management activities. Moreover, you can filter data by up to three physiographic regions and five provider-landownership patterns. State-level data can be refined further by selecting the map, expanding the table, or drilling down on the bar chart. A helpful video on the Forest Landowners Foundation website visually demonstrates how to use this online platform. The platform also provides summarized historical data dating back to 1952, including trend data reported in nominal or historic dollars and real dollars, adjusted for inflation using the Producer Price Index. The dashboard and demonstration video are available at https://www.forestlandowners.com/cost-and-trends-of-southern-forestry-practices/.

Figure 3. Landing page of the new online dashboard for costs and trends of southern forestry practices.
Summary
Forestry practice costs in the South have been more variable in the last 15 years than in past decades. This is due, in part, to the fact that the forest industry has been affected during much of this time by suppressed stumpage prices. The economy and housing market crash in 2008 put financial pressure on corporate forest product companies. This pressure caused restructuring of many companies into Timber Investment Management Organizations (TIMOs) or Real Estate Investment Trusts (REITs) or to divest completely from timberland management of investments. In addition, the low softwood stumpage prices during this time likely influenced decisions of landowners and managers that may have played a role in the variability of forestry practices costs. Labor issues had a role in increased planting costs in recent years, as the cost per seedling to plant remains higher than the costs observed before the highs observed in 2018. Rising labor costs and labor shortages push up costs. Higher fuel and energy costs translate directly into higher operating costs, especially for equipment operation. Diesel and other petroleum products increased in price between 2020 and 2022, with the average annual price of crude oil in 2022 up approximately 141 percent compared to the annual average in 2020. In 2024, the price of crude oil dropped from highs in 2022, but was still relatively high compared to pre-2022 levels and elevated enough to sustain high fuel cost pressure.
Likewise, higher input costs, such as herbicides, fertilizers, machinery parts, and planting stock, among others, resulting from supply chain disruptions and inflation, have affected forestry practice costs. More stringent environmental regulations, permitting, certification, insurance, and liability all add to increases in costs, especially for practices such as prescribed burning and chemical applications. Another thing to mention is scale and economies of use. If less acreage is being treated or if operations are more fragmented (smaller tracts), fixed costs are spread over fewer acres, which pushes up per-acre costs. Similarly, moving equipment between smaller tracts is less efficient and more costly.
 Adam Maggard, Extension Specialist, Associate Professor; Harry E. Murphy, Associate Professor; and SaiTheja Reddy Pullalarevu, Research Assistant, all in Forestry, Wildlife, and Environment, Auburn University.
New November 2025, Costs & Trends of Southern Forestry Practices 2024, FOR-2190