Forestry
Forests are assessed for many reasons—to buy or sell timber products, to help make forest management decisions, or to evaluate non-timber forest resources, such as recreation, wildlife, forage, or pine straw.
Regardless of the reason, information about the forest is collected to adapt and implement proper management practices. This is often done through forest inventories.
When conducting a forest inventory, measuring all trees of interest is usually not affordable. For example, if you measure a 40-acre forest stand with an average of only 300 trees per acre, you would have to measure about 12,000 trees to record every tree in your stand.
Another option is do acquire a representative sample of the tree population of interest. If the 12,000 trees in the example above is the target population, how do you obtain a representative and appropriate sample of these trees? You often use plots.
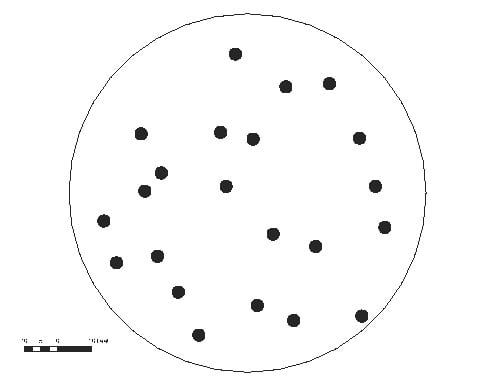
This example shows how trees might be distributed across a 1/5-acre circular plot. (Graphic credit: John Gilbert)
What Is a Plot?
A plot is the sample area of a known shape and size. Plots can be circular, square, or another shape based on a known center point. They can vary in size from just a few feet across to several feet in diameter.
Plot size, shape, and location across the forest will vary and will be based on your objectives. In an older stand of fewer, mainly larger-sized trees, the appropriate plot size might be 1/5 (0.2) acre or even 1/4 (0.25) acre. In a plantation regeneration survey when you are sampling a high density of pine seedlings, a smaller plot size of 1/100 (0.01) or 1/50 (0.02) acre would be appropriate.
How Do I Calculate How Big the Plot Should Be?
When you have decided how big, in area, each plot should be, you can use simple geometric formulas to determine how to lay out a plot in the field. See the following examples for a step-by-step guide to calculating the area and dimensions on either a circular or a square plot.
Calculating a Circular Plot
If you want to use 1/10-acre circular plot in an upcoming forest inventory, how do you compute plot radius, given plot size in acres?
Multiply plot size (in acres) times 43,560 square feet per acre to obtain number of square feet contained in the plot.
1/10 acre (or 0.1 acre) plot = 0.1 acre/plot × 43,560 square feet/acre = 4,356 square feet/plot
Using the formula for the area of a circle, substitute the plot area for “A” and solve for “r” (radius).
Plot area (A) = π × r2
4,356 square feet = 3.14 × r2
4,356 square feet / 3.14 = r2
1,387.26 square feet = r2
√ (1,387.26 square feet) = r
37.24 feet = r or the radius of a 0.1 acre plot
Calculating a Square Plot
If you want to sample the forest understory and establish 1/10,000-acre square plots in an upcoming forestry inventory, how do you compute plot dimensions?
Multiply plot size (in acres) times 43,560 square feet per acre to obtain number of square feet contained in the plot.
1/10,000 acre (or 0.0001 acre) plot = 0.0001 acre/plot × 43,560 square feet/acre = 4,356 square feet/plot
Using the formula for the area of a rectangle or square (Area = width*height or Area = side squared), substitute the plot area for “A” and solve for “w” (width) and “h” (height) or s2 (side squared).
Plot area (A) = s2
4.356 square feet = s2
√ 4.356 square feet = s
2.08 feet = s or one side of a 1/10,000-acre plot
Becky Barlow, Extension Specialist, Assistant Professor, School of Forestry and Wildlife Science, Auburn University
Reviewed July 2023, Calculating the Size of a Forest Inventory Plot, FOR-2058