Farm Management
As we surpass the midpoint of 2022, it is a good chance to explore where crop markets are heading towards harvest. Crop prices have spiked across the board this year largely due to crop supply uncertainty caused by the geopolitical conflict between Russia and Ukraine. This is because these two nations are major exporters of several agricultural commodities which led to market disruptions. The Russian invasion of Ukraine caused uncertainty regarding the size of Ukraine’s crop harvest, their ability to transport the crop across the country, and their port access to ship products overseas. Ukraine is the leading sunflower and sunflower oil exporter – which has disrupted global vegetable oil markets – and is also a major player in wheat and corn. In all, the already high crop prices increased to the highest seen in a decade, but recent macroeconomic factors have led to market volatility over the last two weeks of June raising questions over what prices will look like come harvest.
Cotton
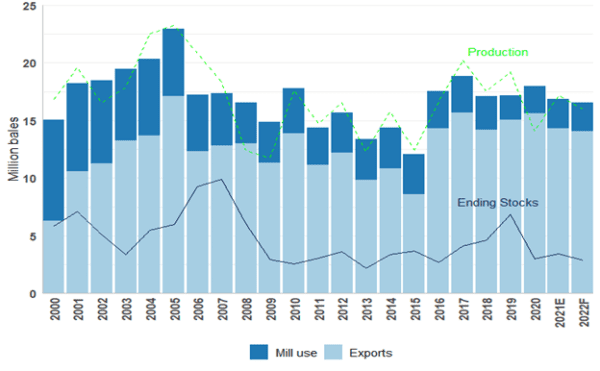
Figure 1. US Cotton Supply and Disappearance
The US saw increased cotton acreage planted in 2022. Overall, acreage was up 11% compared to 2021, with a 5% increase in Alabama. Texas – the largest producing cotton state – planted 755 thousand more cotton acres than last year. The increased acreage is unsurprising given the rise in cotton prices late last year and early this year.
Despite the high planted acreage, production could decrease this year. Weather plays a significant role in determining both the harvested acreage of cotton and yields. The percentage of cotton acreage that ultimately ends up harvested has varied mightily over the past five years. While last year saw only 10% of planted cotton acreage go unharvested, the figures for 2020 and 2018 were 32% and 29%, respectively. The combination of significant drought across Texas and predictions for an active tropical storm season have led to a higher-than-usual forecast abandonment at 25%.
High cotton demand is expected to exceed production for the 2022/2023 marketing year, as shown in figure 1. However, this could change given uncertain macroeconomic conditions. Persistent inflation could affect consumer discretionary spending, potentially lowering cotton demand.
Peanuts
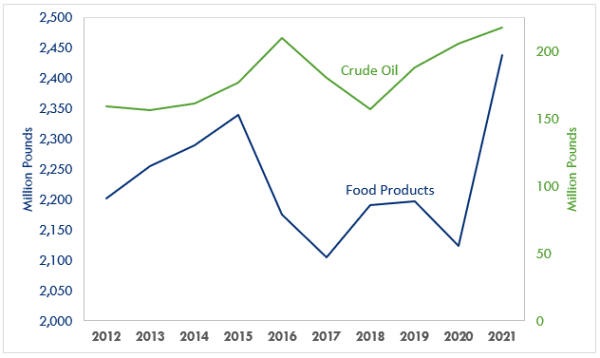
Figure 2. Peanut Product Disappearance by Marketing Year and Product Type (August through April)
Shelled peanut product consumption has been strong over the first three-quarters of the 2021-2022 peanut marketing year, which began August 1, 2021. Ninety percent of peanuts produced in the US are sent to shelling processors. These end up manufactured into food products or crushed for oil. Most peanuts are used for food products, which have seen a 14.8% increase in disappearance over the first three-quarters of the current marketing year, compared to the same period in the previous marketing year. This has been primarily driven by increases in peanut food used for candy production, which is up 15.4% compared to last year. Usage for peanut butter and peanut snacks are down 1.5% and 5.8%, respectively.
Peanuts crushed for oil have increased to 218 million pounds this marketing year (through April), outpacing the same timeframe during the 2020/2021 marketing year by 5.8%, as shown in figure 2. This marks a third consecutive year of increased peanut crude oil disappearance. Other US oilseed crops, such as soybeans, have seen record oil crushings this year. This is likely an effort to offset disruptions to vegetable oil markets caused by the Russian invasion of Ukraine, which has led to reduced sunflower production by Ukraine, the world’s leading sunflower producer and sunflower-oil exporter.
Peanut acreage is down 3% this year nationwide compared to 2021. However, Alabama saw a slight 3% increase up to 190 thousand acres, the only top-four peanut-producing state that did not see acreage decline. Georgia – which produces about half the peanuts in the US – was down 25 thousand acres in 2022. As a result, peanut production is projected to decrease in 2022. Even with increased projected consumption over the next marketing year, ending stocks are still expected to remain over one million tons (figure 3).
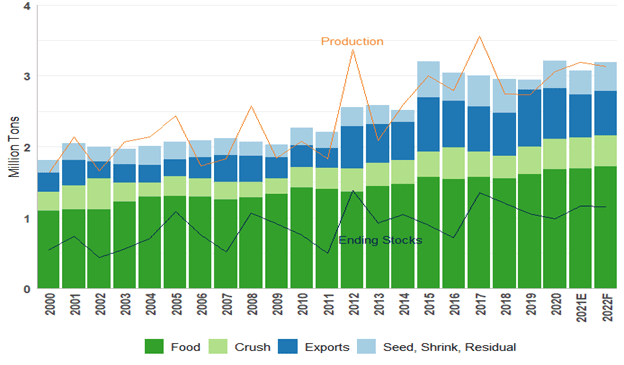
Figure 3. US Peanut Supply and Disappearance
Grains
There were major shifts in 2022 in response to the market conditions. High input prices drove a shift to less fertilizer-intensive crops. Corn acreage declined by 3.4 million acres to 89.92 million acres, while soybean acreage rose to 88.32 million acres, nationwide. Much of the same pattern was observed in Alabama as corn acreage decreased by 15% to 300 thousand acres and soybean acreage increased by 13% to 350 thousand acres. These shifts mirror what is expected on the demand side, with corn use expected to decrease by 2% during the 2022/2023 marketing year, beginning in September. Soybean use is expected to increase by 2% during the same period, in part due to increased soybean oil production.
Wheat acreage increased by 1% nationwide and by 3% in Alabama. Winter wheat yields are projected to be below trend for a second consecutive year, this time driven by drought in the southern Great Plains. Wheat usage is expected to exceed production, which would further reduce wheat stocks which are already at low levels.
What Does This Mean for Prices?
A lot can change in two weeks. A recent price drop across commodity markets has provided more uncertainty to crop producers. Cotton futures prices have fallen twenty cents, a 19% decrease, between June 15 and July 1. Over that same timeframe, wheat prices have decreased 21%, corn 15%, and soybeans 9%. Whether this is the start of a larger bear run or just a temporary dip remains to be seen. Even with these recent declines, table 1 shows that prices remain higher than what has been seen in recent years. However, already-tight margins caused by high input prices may become even tighter should crop prices not rebound.
Crop Prices Compared to Previous Two Years
Note: Futures prices from Chicago Mercantile Exchange and Intercontinental Exchange (cotton).
| Crop | 2020/2021* | 2021/2022* Estimated | 2022/2023* Projected | June 15, 2022 Closing Price | July 1, 2022 Closing Price |
|---|---|---|---|---|---|
| Cotton ($/cwt) | 66.3 | 92.0 | 95.0 | 117.92 (Dec. '22) | 98.84 (Dec. '22) |
| Peanuts ($/ton) | 420 | 484 | 490 | NA | NA |
| Soybeans ($/bu) | 10.80 | 13.35 | 14.70 | 15.35 (Nov. '22) | 13.95 (Nov. '22) |
| Corn ($/bu) | 4.53 | 5.95 | 6.75 | 7.31 (Sept. '22) | 6.20 (Sept. '22) |
| Wheat ($/bu) | 5.05 | 7.70 | 10.75 | 10.57 (July '22) | 8.31 (July '22) |