Farm Management

Since 2005, Alabama’s total population has grown by 13 percent from 4,542,912 to 5,157,699—slightly slower than the 15-percent population growth of the United States. While the state’s overall population numbers have risen over the last two decades, there are significant differences in population growth and decline rates for rural and urban counties in Alabama. Examining these trends is important for a better understanding of the broader impact of population growth and decline on individual communities.
Population growth and decline—rapid or slow—impact and shape local communities through both social and economic factors. For example, rapidly urbanizing areas need additional community infrastructure investments in roadways, schools, and health care systems to support the growing number of individuals within that community. In communities experiencing slow population decline, elected officials and community members should develop plans for a smaller tax base and workforce when planning for the future of their city or town. Understanding population change trends is central to planning for a county or community’s future.
This publication summarizes population trends in Alabama between 2005 and 2024, relying on county-level data drawn from the U.S. Department of Agriculture Economic Research Service and the U.S. Census Bureau Population Division.1 The focus is on overall population change and the components of births, deaths, and migration, with special attention to divergences between urban and rural areas of the state.
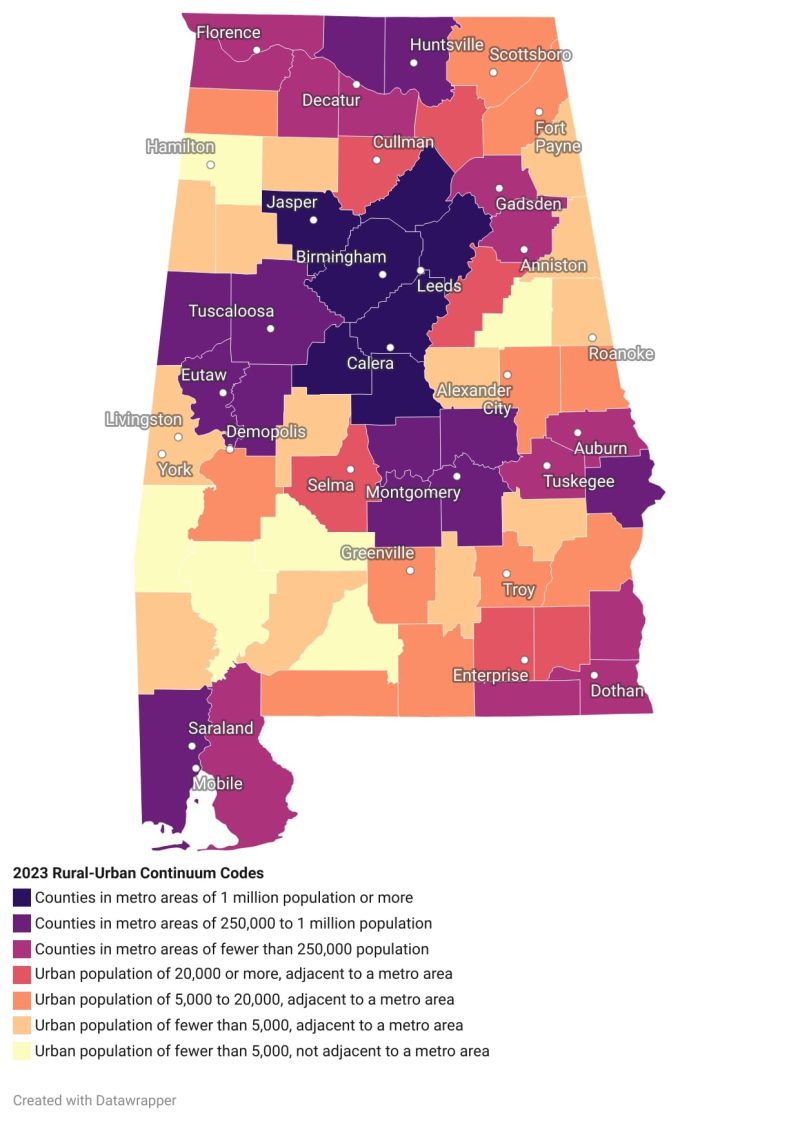
Figure 1. Alabama county classifications based on the Rural-Urban Continuum Codes. Source: U.S. Department of Agriculture Economic Research Service. 2
Population Change in Urban and Rural Counties in Alabama
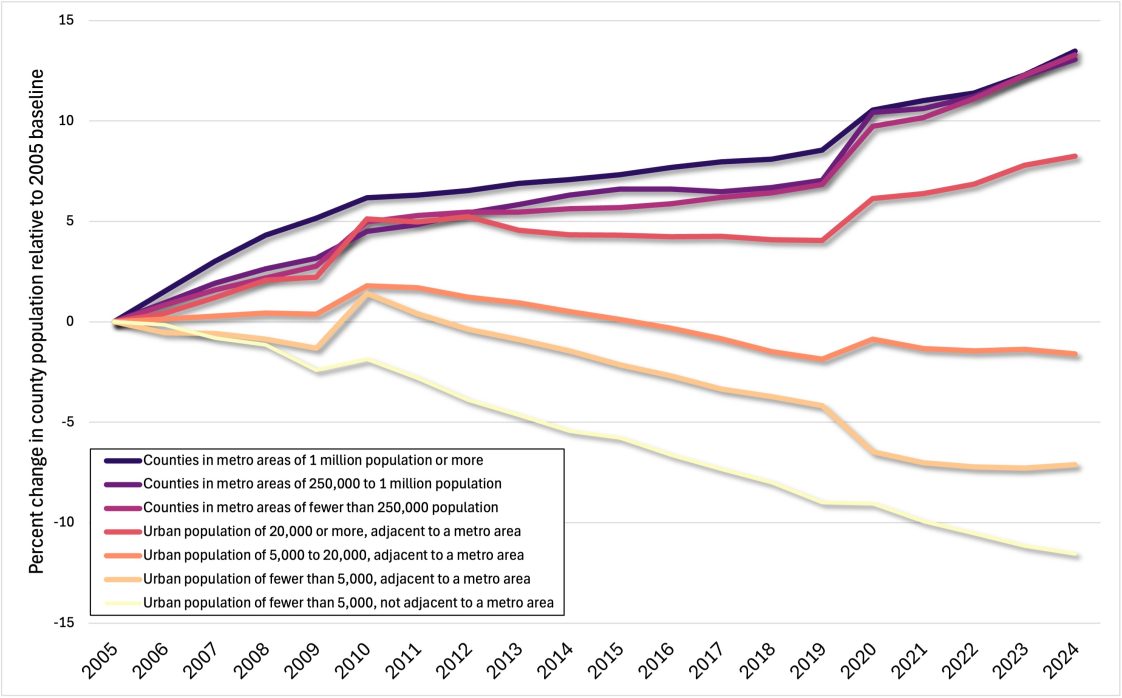
Figure 2. Percent change population by county type, relative to 2005. Sources: U.S. Census Bureau and U.S. Department of Agriculture Economic Research Service.
The divergent trajectories of urban and rural areas of the state can be seen when population figures are grouped into rural or urban counties according to the Rural-Urban Continuum Codes used by the U.S. Department of Agriculture. This classification system divides metropolitan (urban) from nonmetropolitan (rural) counties. See tables 1 to 7 for individual county classifications.
Since 2005, urban counties in Alabama have collectively grown by around 13 percent. For rural counties, only those with an urban center of 20,000 or more have experienced population growth. All other rural counties have experienced population decline over the past 20 years. This suggests a sharp divergence, with urban areas of Alabama experiencing growing populations, while rural areas decline in population.
While Alabama is experiencing overall population growth, this fails to remark on the rural and urban differences and masks a great deal of regional variation (see figure 3). Counties in the state’s rural southwest, northwest, and southeast have experienced population decline. For instance, Greene, Lowndes, Perry, and Wilcox Counties have lost more than 20 percent of their population over the past two decades. In contrast, Baldwin, Lee, Limestone, Madison, and Tuscaloosa Counties have grown by more than 40 percent. While areas experiencing population growth may experience many benefits, policymakers and residents must prepare for new challenges in terms of transportation infrastructure, municipal services, and education costs. In contrast, areas experiencing population decline will likely be challenged by a smaller tax base, a shrinking labor supply, and rising costs for elder care. Tables 1 through 7 provide detailed county-level population change figures.
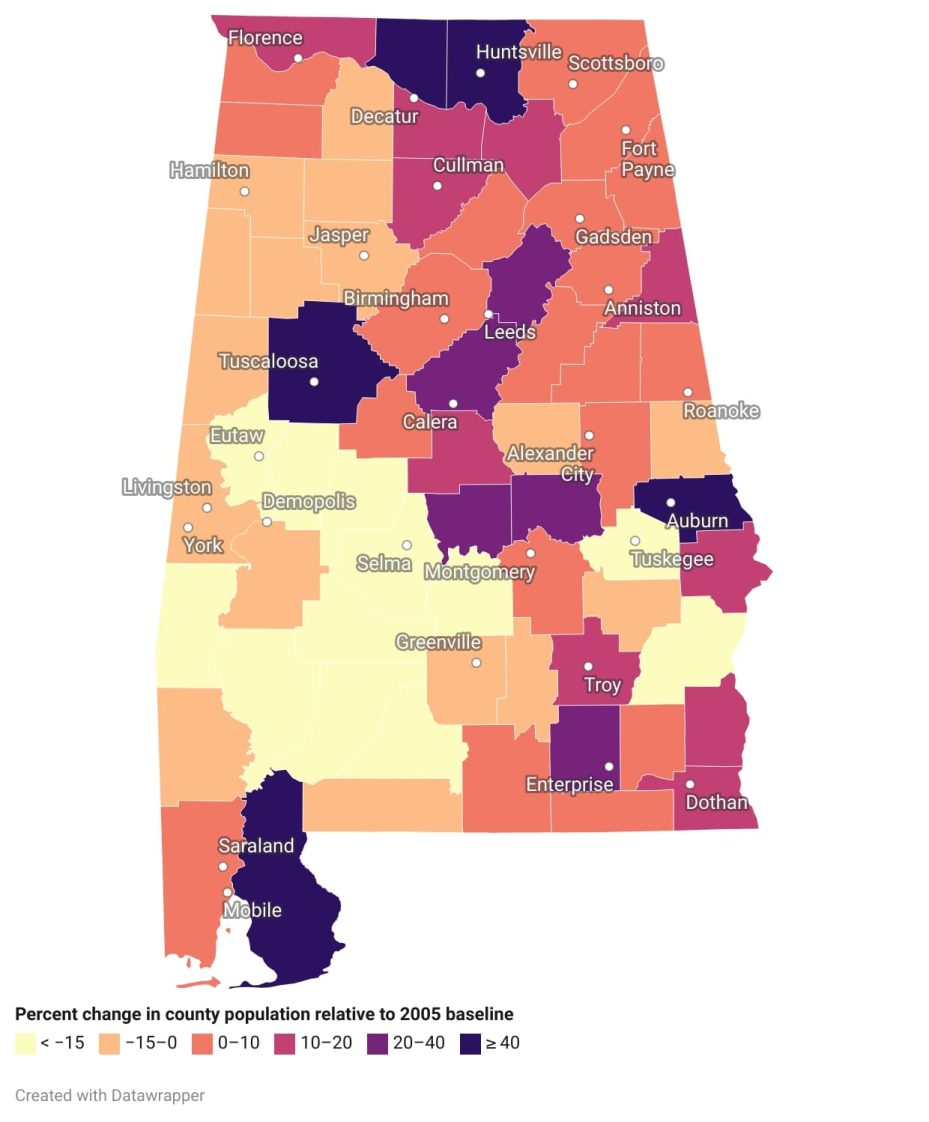
Figure 3. Percent change in total population in Alabama counties between 2005 and 2024. Source: U.S. Census Bureau Population Division.
Natural Population Change
Population change occurs through natural change (births and deaths) in a community and through in- and out-migration. Examining these population change factors individually helps to provide a fuller, more complete picture of what communities are experiencing. This information is also vital for community decision-makers to help plan for the resources and programs their community members might need.
The rate of natural change expresses the difference between births and deaths. Since 2005, this rate in Alabama has been declining for urban and rural counties, although it has consistently been higher for urban counties than rural counties. This two-and-a-half-decade trend has continued despite a sharp decline and rebound during and immediately following the COVID-19 pandemic. Since 2020, the rate has been negative across all county categories, meaning that the number of babies born in rural and urban counties has not outpaced the number of deaths.
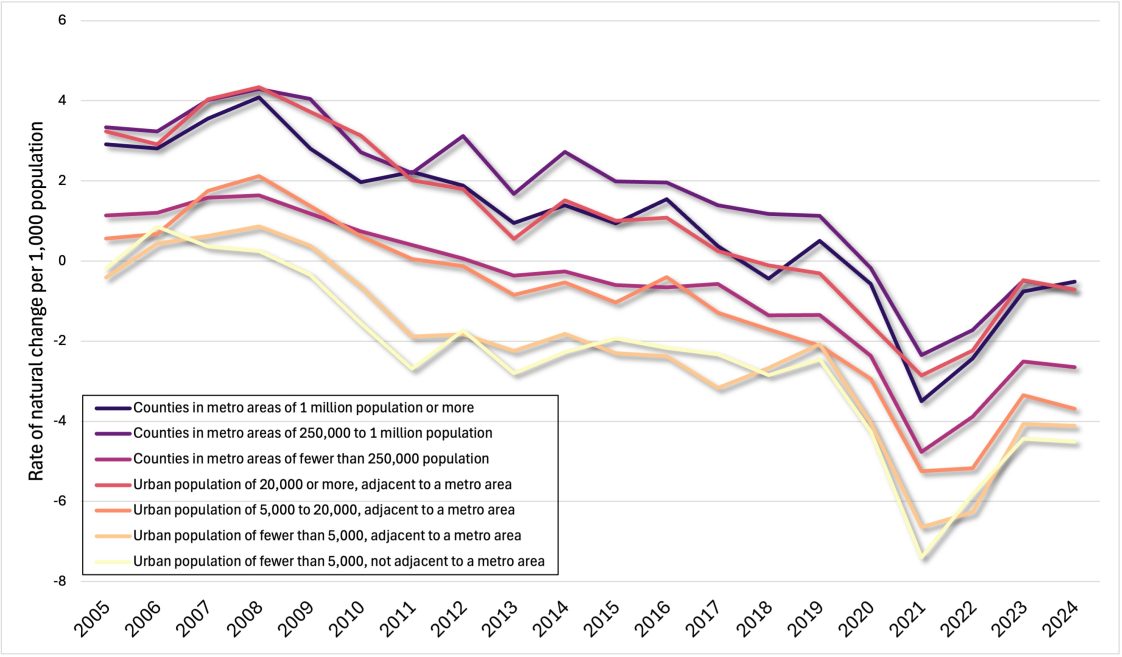
Figure 4. Rate of natural change (births minus deaths) by county type, 2005 to 2024. Sources: U.S. Census Bureau Population Division and U.S. Department of Agriculture, Economic Research Service.
Migration
Besides births and deaths, migration (both domestic and international) is the other major component of population change. The net migration rate shows how many people moved into or out of a county (see figure 5). Among Alabama counties, urban areas have generally had a positive net migration rate, meaning more people are moving into these counties than are leaving. Rural counties, conversely, have generally had a negative net migration rate, meaning more people are leaving than arriving. Following a period of decline from 2005 to 2015, net migration rates across all county types have been rising over the past 10 years. In a context of declining rates of natural population change, much of Alabama’s growth over the past two decades can be attributed to positive net migration in counties in metropolitan areas.
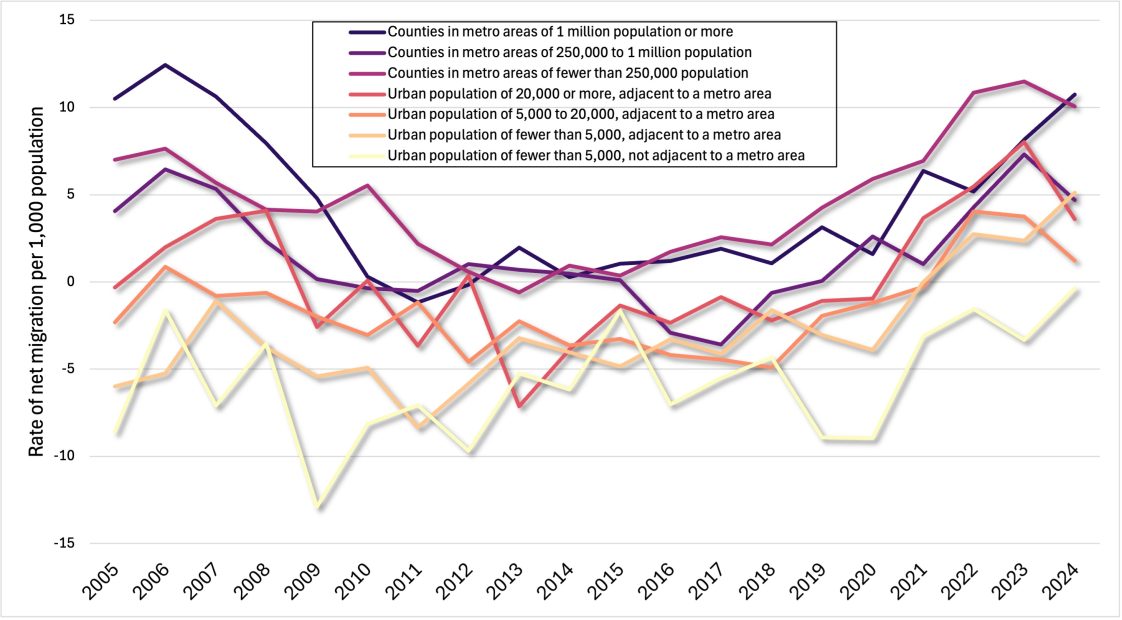
Figure 5. Rate of net migration (domestic and international) by county type, 2005 to 2024. Sources: U.S. Census Bureau Population Division and U.S. Department of Agriculture, Economic Research Service.
Conclusions
Alabama has experienced slightly slower population growth relative to the United States over the past 20 years. Community leaders, businesses, and Alabama residents should recognize the importance of in-migration to this figure and the variation of population growth and decline regionally across the state.
Rural counties have largely declined in population, whereas many urban counties in Alabama have experienced significant population increases. As these communities change, policymakers and local elected officials should draw on population change information to adequately plan for the future shifts in the local workforce, schooling, health care infrastructure, and tax revenue that natural population change and in-and-out migration may bring.
The following tables show the percent change in population in Alabama counties by category between 2005 and 2024.
Table 1. Counties in Metro Areas of 1 Million Population or More, ANR-3162
| County | 2005 pop. | 2024 pop. | % change |
|---|---|---|---|
| Bibb | 21,304 | 22,258 | 4.48 |
| Blount | 55,041 | 60,163 | 9.31 |
| Chilton | 41,640 | 47,262 | 13.50 |
| Jefferson | 659,425 | 664,744 | 0.81 |
| St. Clair | 72,023 | 96,927 | 34.58 |
| Shelby | 171,856 | 235,969 | 37.31 |
| Walker | 69,131 | 65,260 | -5.60 |
Table 2. Counties in Metro Areas of 250,000 to 1 Million Population, ANR-3162
| County | 2005 pop. | 2024 pop. | % change |
|---|---|---|---|
| Autauga | 47,875 | 61,464 | 28.38 |
| Elmore | 73,107 | 91,042 | 24.53 |
| Greene | 9,428 | 7,127 | -24.41 |
| Hale | 17,930 | 15,116 | -15.69 |
| Limestone | 69,807 | 118,942 | 70.39 |
| Lowndes | 12,885 | 9,485 | -26.39 |
| Madison | 299,845 | 423,355 | 41.19 |
| Mobile | 397,698 | 412,339 | 3.68 |
| Montgomery | 222,039 | 225,894 | 1.74 |
| Pickens | 19,794 | 18,508 | -6.50 |
| Russell | 49,139 | 58,837 | 19.74 |
| Tuscaloosa | 172,178 | 241,212 | 40.09 |
Table 3. Counties in Metro Areas of Fewer Than 250,000 Population, ANR-3162
| County | 2005 pop. | 2024 pop. | % change |
|---|---|---|---|
| Baldwin | 162,623 | 261,608 | 60.87 |
| Calhoun | 111,760 | 116,427 | 4.18 |
| Colbert | 54,408 | 58,785 | 8.04 |
| Etowah | 102,637 | 103,207 | 0.56 |
| Geneva | 25,526 | 27,259 | 6.79 |
| Henry | 16,398 | 18,141 | 10.63 |
| Houston | 93,648 | 109,366 | 16.78 |
| Lauderdale | 87,431 | 97,502 | 11.52 |
| Lawrence | 34,323 | 33,567 | -2.20 |
| Lee | 125,280 | 187,847 | 49.94 |
| Macon | 22,454 | 18,159 | -19.13 |
| Morgan | 113,037 | 126,084 | 11.54 |
Table 4. Counties with an Urban Population of 20,000 or More, Adjacent to a Metro Area, ANR-3162
| County | 2005 pop. | 2024 pop. | % change |
|---|---|---|---|
| Coffee | 44,960 | 56,358 | 25.35 |
| Cullman | 79,386 | 92,604 | 16.65 |
| Dale | 47,849 | 50,067 | 4.64 |
| Dallas | 43,347 | 35,545 | -18.00 |
| Marshall | 85,415 | 102,156 | 19.60 |
| Talladega | 80,382 | 81,375 | 1.24 |
Table 5. Counties with an Urban Population of 5,000 to 20,000, Adjacent to a Metro Area, ANR-3162
| County | 2005 pop. | 2024 pop. | % change |
|---|---|---|---|
| Barbour | 29,466 | 24,358 | -17.34 |
| Butler | 20,310 | 18,256 | -10.11 |
| Chambers | 35,163 | 33,813 | -3.84 |
| Covington | 36,608 | 37,784 | 3.11 |
| DeKalb | 66,960 | 73,122 | 9.20 |
| Escambia | 37,698 | 36,630 | -2.83 |
| Franklin | 30,739 | 31,874 | 3.69 |
| Jackson | 52,908 | 53,780 | 1.65 |
| Marengo | 21,384 | 18,512 | -13.43 |
| Pike | 29,674 | 33,124 | 11.63 |
| Tallapoosa | 40,367 | 40,699 | 0.82 |
Table 6. Counties with an Urban Population of Fewer Than 5,000, Adjacent to a Metro Area, ANR-3162
| County | 2005 pop. | 2024 pop. | % change |
|---|---|---|---|
| Bullock | 10,952 | 9,901 | -9.60 |
| Cherokee | 24,191 | 26,138 | 8.05 |
| Cleburne | 14,278 | 15,905 | 11.40 |
| Coosa | 10,933 | 10,291 | -5.87 |
| Crenshaw | 13,518 | 13,114 | -2.99 |
| Fayette | 18,074 | 15,863 | -12.23 |
| Lamar | 14,706 | 13,543 | -7.91 |
| Monroe | 23,179 | 19,057 | -17.78 |
| Perry | 10,793 | 7,719 | -28.48 |
| Randolph | 22,452 | 23,067 | 2.74 |
| Sumter | 13,616 | 11,607 | -14.75 |
| Washington | 17,387 | 15,018 | -13.63 |
| Winston | 24,185 | 23,869 | -1.31 |
Table 7. Counties with an Urban Population of Fewer Than 5,000, Not Adjacent to a Metro Area, ANR-3162
| County | 2005 pop. | 2024 pop. | % change |
|---|---|---|---|
| Choctaw | 14,537 | 12,052 | -17.09 |
| Clarke | 26,728 | 22,142 | -17.16 |
| Clay | 13,823 | 14,239 | 3.01 |
| Conecuh | 13,163 | 11,109 | -15.60 |
| Marion | 29,484 | 29,323 | -0.55 |
| Wilcox | 12,627 | 9,865 | -21.87 |
1These datasets are county population estimates, produced annually by the Census Bureau and relying on data inputs from administrative sources such as the Internal Revenue Service, Medicare, and the Federal Election Commission. While these are the most robust annual estimates available, there is a degree of uncertainty in these figures, which is especially relevant for certain areas (e.g., sparsely population rural counties) and certain subjects (e.g., migration).
2The Rural-Urban Continuum Codes (RUC) classify metropolitan counties into three categories based on population size of the metro area (1 million or more; 250,000 to 1 million; fewer than 250,000). Nonmetro counties are classified into six categories based on degree of urbanization and adjacency to metropolitan areas. These classifications account for the influence of proximity to urban services and facilities for rural areas. Two categories from the RUC are not present in Alabama: urban population of 20,000 or more, not adjacent to a metro area and urban population of 5,000 to 20,000, not adjacent to a metro area.

 Matthew J. Zinsli, Postdoctoral Scholar, Auburn University Rural Partnership Institute and Department of Agricultural Economics and Sociology, and Kelli J. Russell, Assistant Extension Professor, and Mykel R. Taylor, Professor, Alfa Endowed Chair, and Department Head, both with the Department of Agricultural Economics and Rural Sociology, Auburn University
New May 2025, Alabama in Focus: Population Trends Snapshot 2005–2024, ANR-3162