Farm Management
During the past two decades, Alabama’s total population has grown to 5,157,699. Understanding population change is crucial for communities as they plan to respond to different demographic shifts.1 Labor trends are especially important for counties and communities, as a stable working-age workforce is necessary to meet labor market needs. This publication summarizes labor trends in Alabama from 2002 to 2024, drawing on county-level data from the US Census Bureau, the US Department of Agriculture, the US Bureau of Economic Analysis, and the US Bureau of Labor Statistics. The data illustrate ongoing changes regarding employment and the local tax base, which are important for individuals, policymakers, and employers.
Working-Age Population
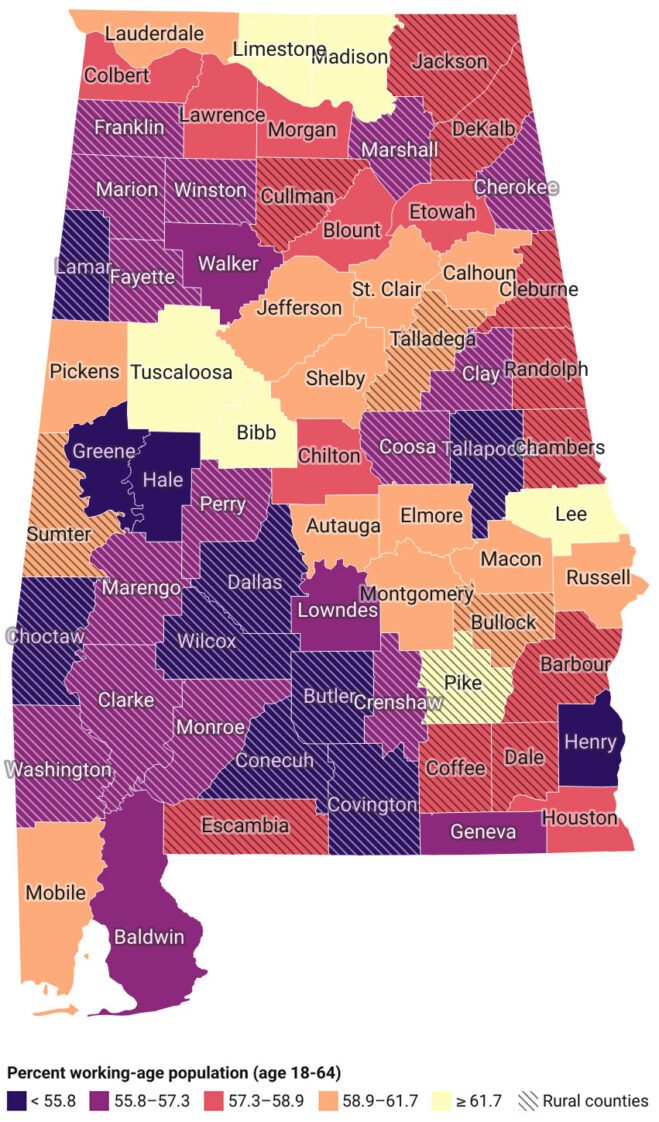
Figure 1. Percent working-age population in Alabama counties (2024). Source: US Census Bureau Population Division.4 Access an interactive map at https://aub.ie/al_working_pop_2024.
The US population is getting older due to increased longevity and declining birth rates. The entrance of the Baby Boom generation (those born between 1946 and 1964) into retirement age has raised concerns about the ability of a shrinking workforce to support a growing pool of retirees. The percentage of the population that is of working age (ages 18 to 64) offers a good measure of these trends.
Across the state of Alabama, the working-age population has declined by 3.5 percentage points since 2010, from 61.4 percent in that year to 57.9 percent in 2024. As in other parts of the country, this trend is likely driven by a combination of aging, outmigration of young adults for work and education, and in-migration of retirees. This statewide pattern holds for both urban and rural counties in the state, with declines of around 3.5 percentage points in both categories.2
However, rural counties, on average, have about 2 percentage points fewer working-age residents than urban counties. This pattern is especially evident in certain regions of the state (figure 1). For example, in rural counties in the southwest region, such as Conecuh (53.5 percent), Covington (54.8 percent), Dallas (55.0 percent), Butler (55.2 percent), Wilcox (55.2 percent), and Choctaw (55.6 percent), nearly half the population is now made up either of children under the age of 18 or residents beyond retirement age. By contrast, in more urban counties such as Lee, Tuscaloosa, Madison, Limestone, and Bibb, nearly two-thirds of the population is of working age.3
For both rural and urban Alabama counties, the trend of a declining proportion of the working-age population is likely to continue in the near future. This raises concerns about the availability of workers to meet the needs of industry and local labor markets in all areas of the state. The aging population will likewise require increases in the provision of health care as well as social and community services. While policymakers, planners, business leaders, and residents across the state need to account for these potential challenges, the concerns are especially acute for rural areas that already have a smaller labor pool.
Citations
1 See “Alabama in Focus: Population Trends Snapshot, 2005–2024”on the Alabama Extension website at www.aces.edu.
2 The classification of Alabama counties as either “urban” or “rural” is based on the US Department of Agriculture Economic Research Service’s Rural-Urban Continuum Codes, which classify metropolitan (urban) counties by the population size of their metropolitan area and nonmetropolitan (rural) counties by the population size of their urban center and their proximity to metropolitan areas.
3 The measure of working-age population includes all residents ages 18–64, which for counties such as Lee and Tuscaloosa is likely to include a larger proportion of nonworking college students.
4 These data are county population estimates, produced annually by the Census Bureau and relying on data inputs from administrative sources. While these are the most robust annual estimates available, there is a degree of uncertainty in these figures, which is especially relevant for certain areas (e.g., sparsely populated rural counties).
Unemployment
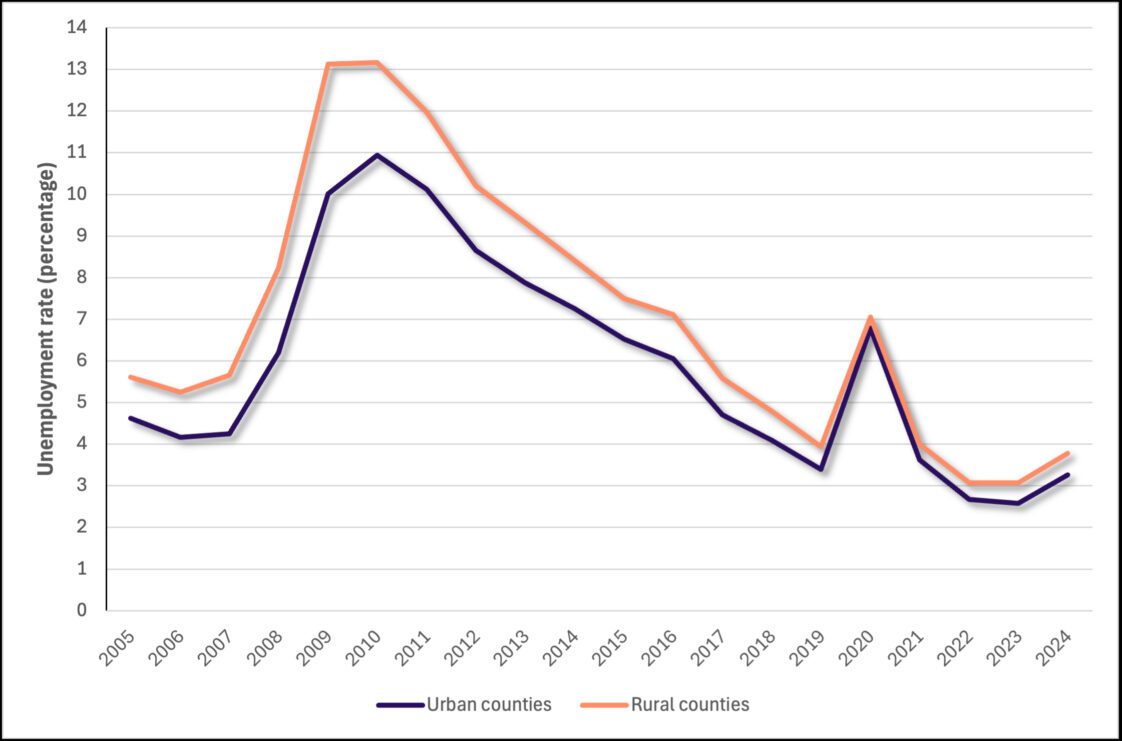
Figure 2. Unemployment rate in Alabama counties, 2005–2024. Source: US Bureau of Labor Statistics.
Unemployment can make it challenging for individuals, families, and communities to support themselves. The unemployment rate measures the number of unemployed people as a percentage of those in the labor force (those employed or actively looking for work). This rate provides a good indicator of the supply of jobs in an area relative to demand.
Since 2005, rural Alabama counties have persistently experienced a higher unemployment rate than urban counties (figure 2). From 2005 to 2016, this difference was generally around 1 percentage point, although it spiked to as much as 3 percentage points during the Great Recession. However, the gap between urban and rural counties has narrowed since around 2018 to only about half a percentage point. This trend has continued despite a spike in unemployment during the COVID-19 pandemic. As of 2024, the latest year for which these data are available, the unemployment rate for both urban and rural Alabama counties has been less than 4 percent.
In addition to the difference in unemployment rate between urban and rural counties, there are stark differences for certain regions of the state (figure 3). The counties with the highest unemployment rates are concentrated in rural counties in the southwest part of the state. For instance, Perry, Dallas, Wilcox, and Clarke counties all have unemployment rates above 5 percent. The counties with the lowest unemployment rates are generally located in metropolitan areas around Birmingham, Montgomery, and Huntsville, suggesting that proximity to the state’s urban core is an important source of employment.
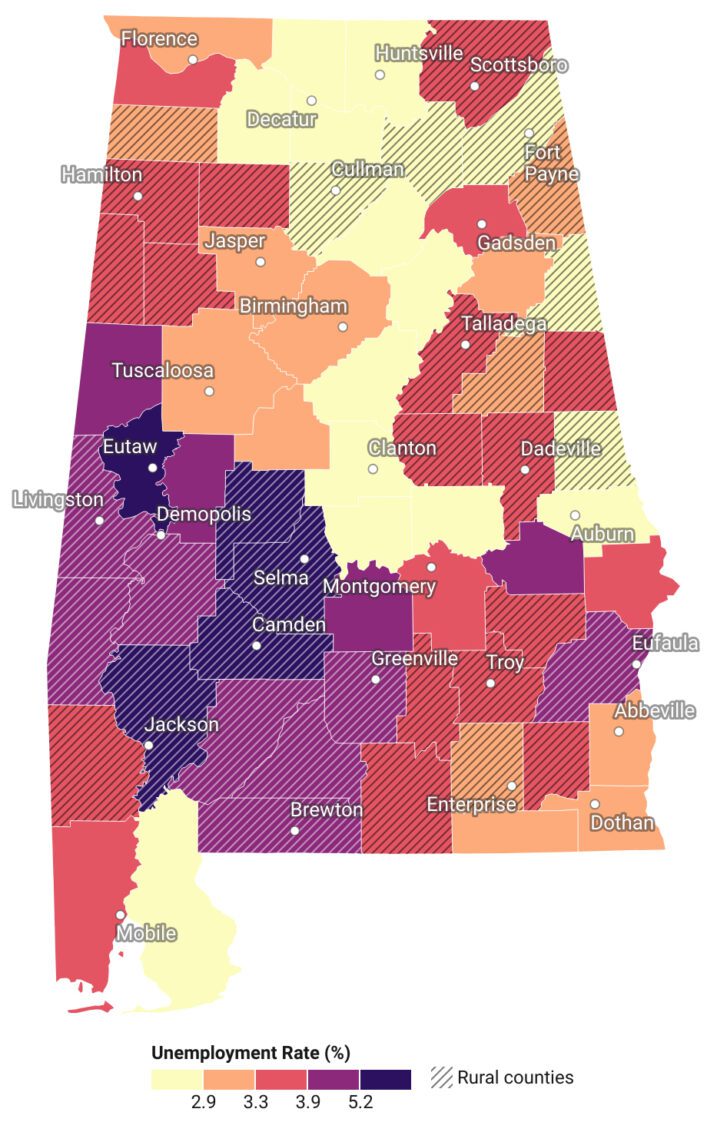
Figure 3. Unemployment rate in Alabama counties (2024). Source: US Bureau of Labor Statistics.
Changing Composition of Employment
A significant amount of variance exists among rural and urban Alabama counties in the distribution of jobs across different industrial sectors.5 Manufacturing dominates rural employment, with nearly one in five jobs in rural counties found in this sector as of 2022 (figure 4).6 In contrast, only 8 percent of jobs in urban counties are in manufacturing. A quarter of rural jobs are in public administration (federal, state, and local government) and retail—two sectors that are also important for urban counties.
While the share of jobs across many sectors is comparable between urban and rural counties, there are important divergences. The share of jobs in farming, ranching, fishing, and logging is five times larger in rural counties than in urban counties. Proportionally, sectors such as entertainment, recreation, and hospitality, finance, insurance, and real estate, health care, and professional services are more important to employment in urban counties than in rural counties.
However, these figures have shifted significantly in the past two decades. Looking just at rural counties, five industries have declined as a share of overall employment since 2002: manufacturing, retail, public administration, media and telecommunications, and farming, ranching, fishing, and logging (figure 5). The decline in rural manufacturing is particularly concerning because of its overall importance to rural employment. As a share of rural jobs, manufacturing has declined from 25 percent to 20 percent of all jobs this century. Much of the employment in this sector was hard hit by the Great Recession, and the recovery has been slow. In contrast, jobs in farming, ranching, fishing, and logging have steadily declined, driven in part by increased mechanization in these industries.
In contrast, the sectors that have seen the largest increase as a share of rural employment are, with the exception of mining, quarrying, fossil fuel extraction, and utilities, all in the service sectors (figure 6). Overall, these data indicate that the employment profile of Alabama’s rural counties is shifting. Traditional sectors that rely on the extraction of natural resources and the production of goods are becoming less important as drivers of job growth in these areas, while service-based sectors have become much more prominent. This largely mirrors trends from across the United States in recent decades, as rural economies depend more on amenity-based tourism, retirement relocations, health care, and a suite of business and professional services catering to rural businesses and residents. These sectoral changes are likely to drive shifts in the rural tax base and the composition of communities.
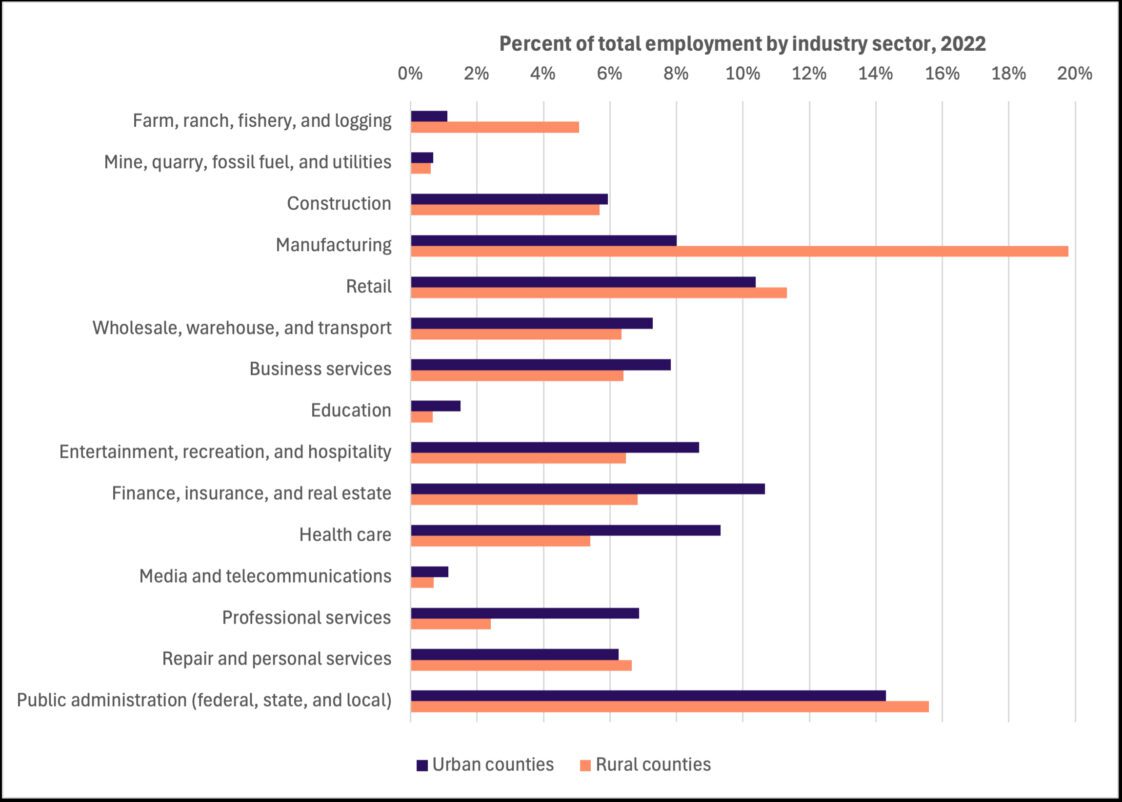
Figure 4. Employment by industry sector in urban and rural counties in Alabama, 2022. Source: US Bureau of Economic Analysis.7
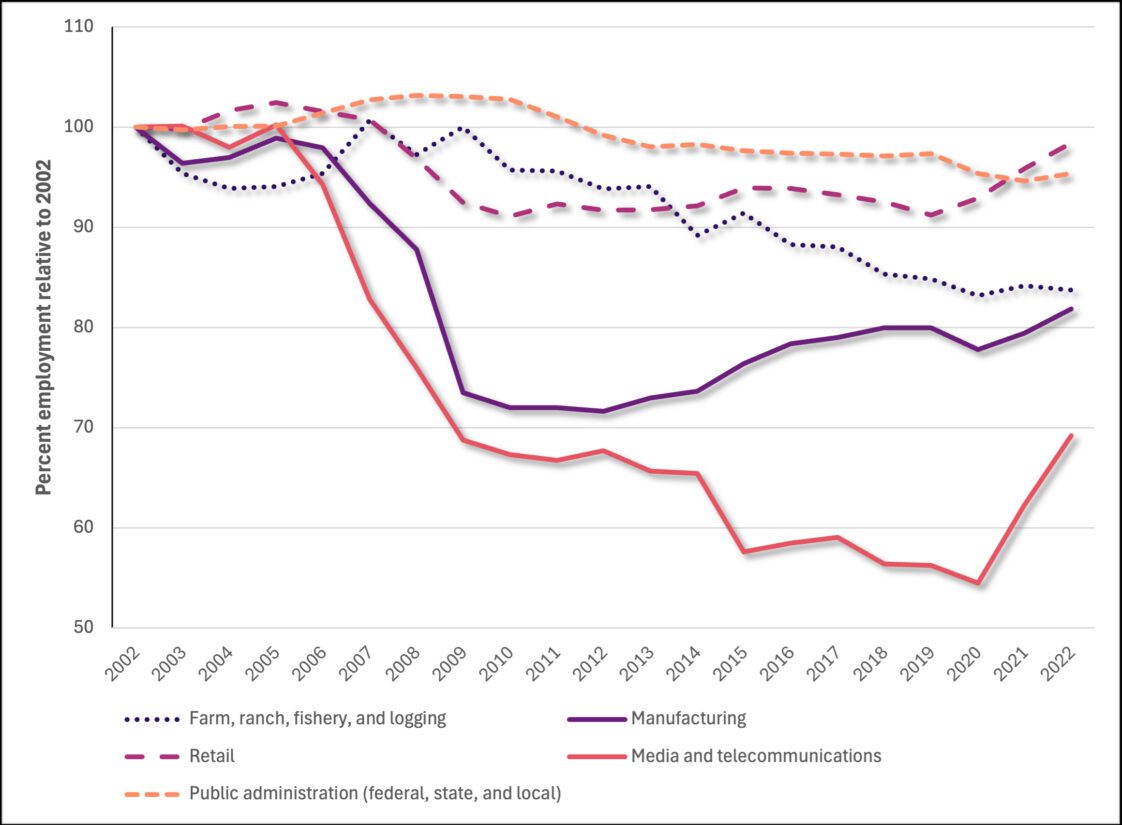
Figure 5. Industry sectors that have declined as a percentage of employment in rural counties in Alabama since 2002. Source: US Bureau of Economic Analysis.
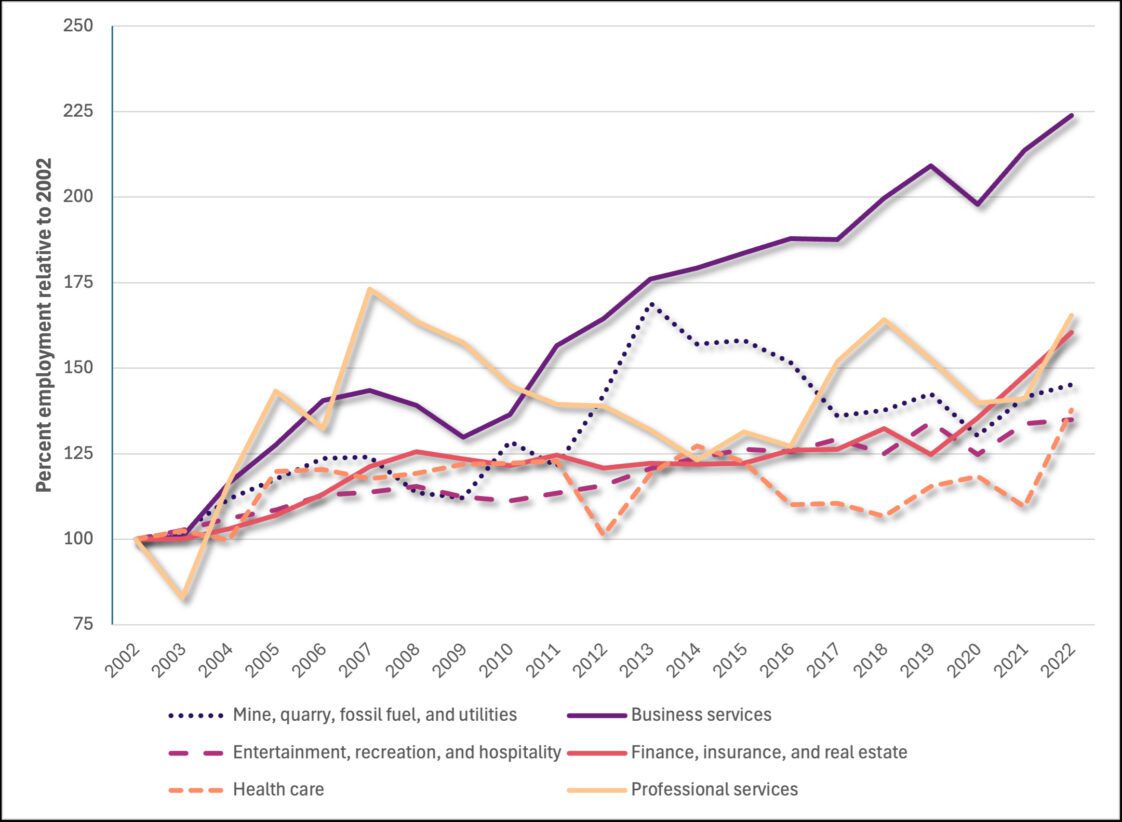
Figure 6. Industry sectors that have increased as a percentage of employment in rural Alabama counties since 2002. Source: US Bureau of Economic Analysis.
Citations
5 These industrial sector classifications are based on the North American Industry Classification System (NAICS). We collapsed and renamed these categories to provide a more concise and comprehensible overview of employment trends in Alabama. See the Appendix for a detailed overview.
6 These data at the county level are only available up to 2022.
7 These data from the Bureau of Economic Analysis exclude some data to avoid disclosure of confidential information, for instance, in rural counties where there may be only one or two major employers in a sector such as forestry. As such, estimates for certain industry categories in certain counties may be underreported.
Conclusion
The changes in unemployment, industry sector jobs, and the working-age population in Alabama since 2002 are not drastically different from those of the entire United States. However, the stark differences in some categories between urban and rural counties and the declining rate of some industry sector jobs are data points that community leaders, employers, and elected officials should note. To adequately plan for the future of Alabama communities, labor and workforce trends are central data points to consider.
Appendix
Table 1. Overview of Creation of Industry Sector Categories Based on NAICS Codes
| Industry sector | NAICS sectors | NAICS codes |
|---|---|---|
| Farm, ranch, fishery, and logging | Agriculture, forestry, fishing, and hunting | 11 |
| Mining, quarrying, fossil fuel, and utilities | Mining, quarrying, and oil and gas extraction | 21 |
| Mining, quarrying, fossil fuel, and utilities | Utilities | 22 |
| Construction | Construction | 23 |
| Manufacturing | Manufacturing | 31–33 |
| Retail | Retail trade | 44–45 |
| Wholesale, warehouse, and transport | Wholesale trade | 42 |
| Wholesale, warehouse, and transport | Transportation and warehousing | 48–49 |
| Business services | Management of companies and enterprises | 55 |
| Business services | Administrative and support and waste management and remediation service | 56 |
| Education | Educational services | 61 |
| Entertainment, recreation, and hospitality | Arts, entertainment, and recreation | 71 |
| Entertainment, recreation, and hospitality | Accommodation and food services | 72 |
| Finance, insurance, and real estate | Finance and insurance | 52 |
| Finance, insurance, and real estate | Real estate and rental and leasing | 53 |
| Health care | Health care and social assistance | 62 |
| Media and telecommunications | Information | 51 |
| Professional services | Professional, scientific, and technical services | 54 |
| Repair and personal services | Other services (except public administration) | 81 |
| Public administration (federal, state, and local) | Public administration | 92 |
For More Information
Davis, James C., Anil Rupasingha, John Cromartie, and Austin Sanders. 2022. Rural America at a Glance: 2022 Edition. Economic Information Bulletin Number 246. Washington, D.C.: U.S Department of Agriculture Economic Research Service.
He, Wan, Daniel Goodkind, and Paul Kowal. 2016. An Aging World: 2015. P95-16–1. Washington, D.C.: U.S. Census Bureau.
Zinsli, Matthew J., Kelli J. Russell, and Mykel R. Taylor. 2025. ANR-3162. Auburn, AL: Auburn University.
 Matthew J. Zinsli, Postdoctoral Fellow; Kelli Russell, Assistant Extension Professor; and Mykel R. Taylor, Head, Professor, and ALFA Eminent Scholar, all in Agricultural Economics and Rural Sociology with Auburn University
New January 2026, Alabama in Focus: Labor Trends Snapshot 2002–2024, ANR-3198