Crop Production
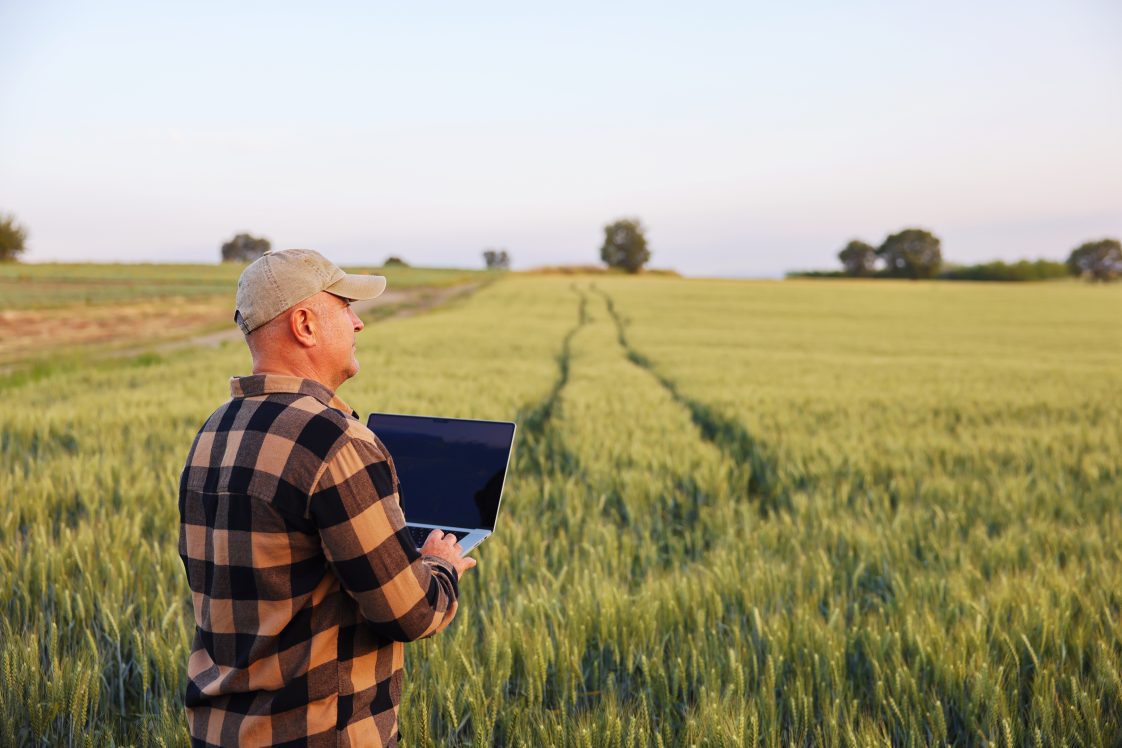
Precision agriculture tools, such as satellite images, drones, and handheld sensors, are used to check the status of crops or identify areas of concern and for persistent monitoring. These tools measure how healthy your crops are, whether they need water, or if they are lacking nutrients, such as nitrogen.
Several indices are commonly used in precision agriculture. For example, the Normalized Difference Vegetation Index (NDVI) shows general plant health; the Normalized Difference Moisture Index (NDMI) indicates vegetation moisture content; and the Normalized Difference Red Edge (NDRE) and Chlorophyll Content Index (CCI) help spot nutrient problems. The Enhanced Vegetation Index (EVI) performs well in fields with a lot of leaves, while the Green NDVI (GNDVI) is useful for identifying early chlorophyll changes. The Crop Water Stress Index (CWSI) uses the temperature difference between plants and the air to more precisely measure water stress.
This publication aims to increase knowledge about common indices derived using remotely sensed data and help guide farmers in selecting and effectively using the most suitable vegetation indices for improved crop management. Farmers do not have to be technical experts, as these crop maps are easy to get through farming apps or by working with local agricultural consultants. These experts often handle complex data analysis and simply provide the farmer with easy-to-read maps and advice. Handheld gadgets allow farmers to double-check items on the ground, and drones can provide precise images to identify trouble spots. Always scout the field to confirm what you see in the remotely sensed data, such as examining the soil, analyzing plant leaves, or checking for pests. The real power of these tools is in tracking how your crops change over time. This helps you catch issues early and only apply water, fertilizer, or sprays where needed, cutting costs and boosting yields. Remote sensing turns guesswork into precise, proactive management, a key to farming profitably in unpredictable conditions.
Introduction
With the increased adoption of technology among growers and crop consultants, remote sensing has emerged as a straightforward and reliable tool for understanding farm conditions and taking preventive actions. Simply relying on visual inspections in the field is no longer sufficient for maintaining crop health and productivity. Today, advanced technologies, such as satellites, drones, and handheld sensors, enable farmers to detect early signs of crop stress even before visible symptoms appear.
These technologies provide data that we can use to calculate vegetation indices (VIs), which indicate plant health, water availability, and nutrient status. By interpreting these indices, growers can quickly identify issues such as drought, nitrogen deficiency, or diseases and make informed, timely decisions to protect their crops.
Table 1 provides an easy-to-understand summary of commonly used vegetation indices (VIs), including their formulas, value ranges, and interpretations. These indices can help farmers differentiate between healthy plant conditions and early stress signals.
Table 1. Common Vegetation Indices Used in Precision Agriculture: Formulas, Value Ranges, and Interpretation Guidelines for Crop Health Monitoring, ANR-3180
| Abbreviation | Full Name | Equation | Healthy Range | Problematic Range | Primary Applications | Best Data Source |
|---|---|---|---|---|---|---|
| NDVI | Normalized Difference Vegetation Index | (NIR − Red) / (NIR + Red) | 0.6–0.9 | <0.4 | General plant health, biomass estimation | Satellite, UAV |
| GNDVI | Green NDVI | (NIR − Green) / (NIR + Green) | 0.5–0.8 | <0.3 | Early stress detection, chlorophyll content | Satellite, UAV, handheld |
| NDRE | Normalized Difference Red Edge Index | (NIR − RedEdge) / (NIR + RedEdge) | 0.3–0.6 | <0.2 | Mid-late season nitrogen status | Satellite, UAV, spectral sensors |
| EVI | Enhanced Vegetation Index | (2.5 × (NIR − Red)) / (NIR + 6 × Red − 7.5 × Blue + 1) | 0.2–0.8 | <0.15 | Dense canopy monitoring | Satellite |
| CCI | Chlorophyll Content Index | (NIR / RedEdge) − 1 | 5–20 | <4 | Nitrogen, Mg, Fe deficiency | Handheld, UAV |
| MSI | Moisture Stress Index | SWIR / NIR | 0.5–1.2 | >1.5 | Drought monitoring | Satellite, spectral sensors |
| NDMI | Normalized Difference Moisture Index | (NIR − SWIR) / (NIR + SWIR) | 0.2–0.5 | <0.1 | Canopy water content, drought monitoring | Satellite, UAV, hyperspectral sensors |
| CWSI | Crop Water Stress Index | (Tcanopy − Tair) / Vapor Pressure Deficit | 0.2–0.5 | >0.6 | Irrigation scheduling | Thermal sensors |
Indices for Monitoring Overall Crop Health
The Normalized Difference Vegetation Index (NDVI) is a simple and widely used tool for assessing overall plant health by measuring near-infrared (NIR) and red light. Healthy crops typically have NDVI values between 0.6 and 0.9, indicating strong growth. Stress from diseases, drought, or nutrient deficiencies can lower (NDVI) values below 0.4.
While the Normalized Difference Vegetation Index (NDVI) is useful for general monitoring, it has limitations, especially in dense crops, where early stress might not be detected. Figure 1 shows an example of how NDVI changes over a growing season for soybeans, reflecting healthy growth periods and maturity.
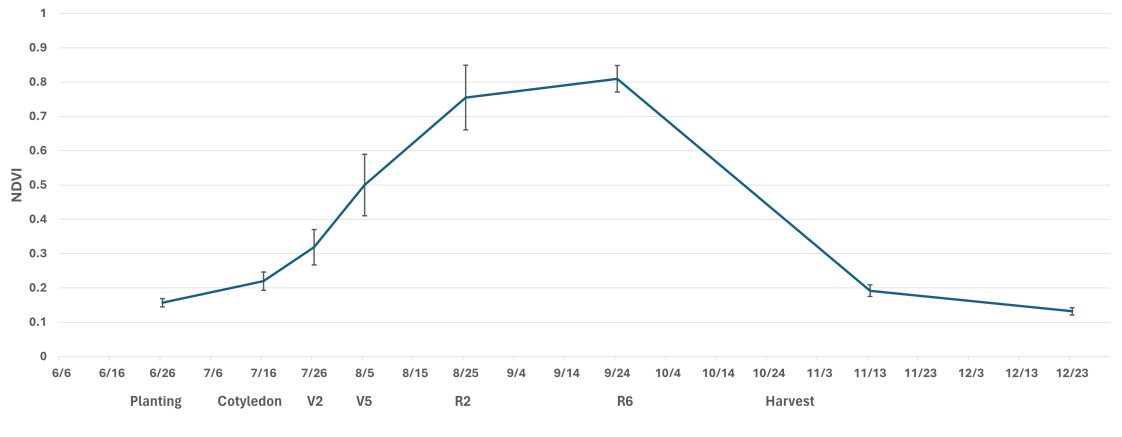
Figure 1. Illustrates the NDVI-based timeline of soybean health throughout the growing season. Each point on the line represents the average NDVI across the field on a particular date, while the vertical bars show standard deviation, indicating variability in canopy conditions across different parts of the field. Cotyledon marks the emergence of the first leaves; V-stages (e.g., V2, V5) are vegetative phases with leaf counts; R-stages (e.g., R2, R6) are reproductive phases from full bloom to full seed/peak biomass.
Think of figure 1 as a timeline for your soybean field’s health. The Normalized Difference Vegetation Index (NDVI) values on the left axis show how green and dense your crop canopy is. Each point on the line represents the average NDVI across the field on that date, and the bars above and below show how much variability exists within the field. A wide bar means conditions vary more across the field; a short bar means the crop is growing more evenly. The graph shows plants starting small after planting, growing rapidly through the summer (V2 to R6 stages), and then naturally declining as the crop matures and prepares for harvest. Higher values mean a healthy, full canopy. Lower NDVI values are expected early in the season when plants are just emerging and again after harvest. However, low values during the mid-vegetative or early reproductive stages may signal areas with bare soil or weaker plants that could be stressed by pests, weeds, or lack of water.
Similar to the Normalized Difference Vegetation Index (NDVI), the Green NDVI (GNDVI) effectively detects early signs of stress by using green light because green light is sensitive to changes in chlorophyll concentration. Healthy plants typically have GNDVI values from 0.5 to 0.8, while values below 0.3 indicate severe stress.
The Enhanced Vegetation Index (EVI) works well in dense crop fields because it corrects soil and atmospheric effects. Healthy plants usually have EVI values between 0.2 and 0.8, whereas values under 0.15 show poor growth. Vegetation indices (VIs) can help you spot areas in the field that may need attention, like places where crops are stressed or growing unevenly. But the maps in this publication are just a starting point as they work best when used with in-field scouting and advice from crop advisers or agriculture experts. Using VIs along with your own field knowledge helps you make better, more informed decisions.
Indices for Detecting Water Stress
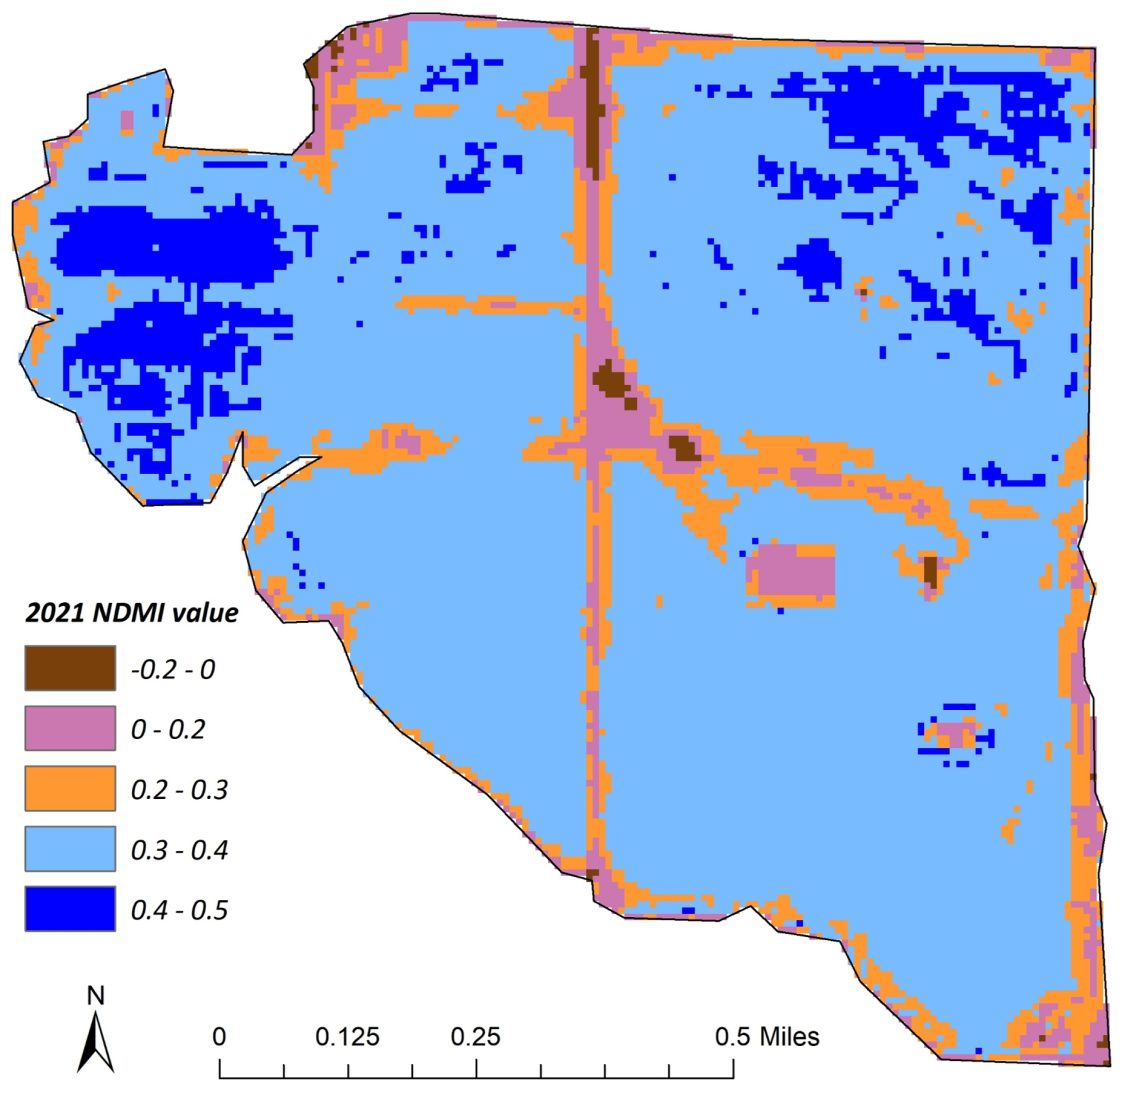
Figure 2a. Normalized Difference Water Index (NDMI) maps from Sentinel-2 data showing soybean crop condition: (a) healthy soybeans with enough water in 2021.
Water stress remains one of the biggest challenges for growers in Alabama, but using vegetation indices can help identify stressed crops before major damage occurs. The useful tool for detecting water stress is the Normalized Difference Water Index (NDMI). This index uses near-infrared (NIR) and shortwave infrared (SWIR) parts of light to detect changes in vegetation and soil moisture levels. It does not measure how much water is inside the plants, but changes in the index values can help show parts of the field that might be getting too dry or starting to feel drought stress. An NDMI below 0.1 indicates significant water stress. If NDMI values are below 0.2, your crops might be under water stress or have low canopy cover. Values above 0.2 usually mean healthier crops, and anything over 0.4 shows good canopy and no water stress. NDMI values from 0.4 to 0.8 indicate high to very high canopy cover and no water stress, typical of healthy, well-irrigated crops. However, this threshold is only a guideline. NDMI captures average conditions over time and may not reflect rapid, short-term changes in moisture that happen during the day due to heat, wind, or irrigation. These values should always be viewed alongside local knowledge, recent rainfall, and field scouting. NDMI is most useful when tracked over time or used in combination with other tools to guide irrigation or management decisions. Figure 2 shows how soybeans were doing in two different years. In 2021 (figure 2a.), most fields were blue, meaning the crops had enough water and were healthy. But in 2024 (figure 2b.), you can see more brown and purple areas, showing that those soybeans were stressed due to drought and needed more water.
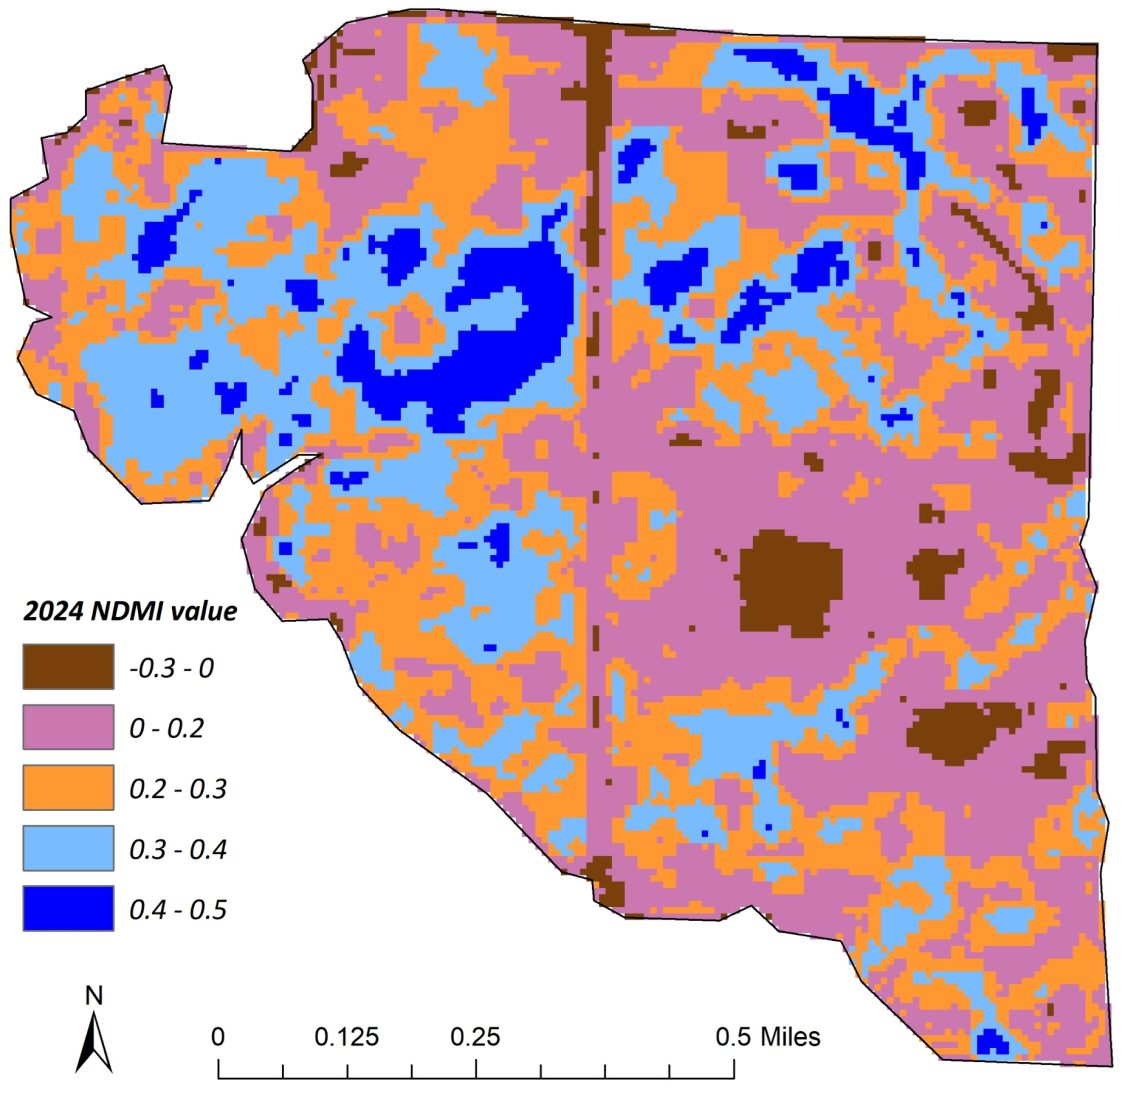
Figure 2b. Normalized Difference Water Index (NDMI) maps from Sentinel-2 data showing soybean crop condition: soybeans under water stress during drought in 2024.
Using a special handheld or drone-mounted thermal camera, the Crop Water Stress Index (CWSI) provides information on a crop’s canopy temperature. Plants under water stress tend to be warmer, so this method compares the current canopy temperature to two reference points: the coolest possible temperature (representing a well-watered plant) and the hottest possible temperature (indicating severe stress), all under the same weather conditions. The result is a score between 0 and 1, where values from 0.2 to 0.5 suggest mild stress, and scores above 0.6 indicate severe stress requiring immediate irrigation.
Unlike other vegetation indices, which rely on light reflected by plants, the Crop Water Stress Index (CWSI) uses thermal infrared sensors combined with weather data such as air temperature and humidity to estimate water stress. By using these indices, farmers can target irrigation more accurately, ensuring water is delivered where it is needed most and enhancing overall efficiency. However, this method requires specialized thermal cameras and complex software that can be costly, which may limit its use on most farms.
Shortwave infrared (SWIR)–based indices like Normalized Difference Moisture Index (NDMI) and Moisture Stress Index (MSI) rely on specific wavelengths sensitive to moisture levels in plants and soil. These indices are excellent for monitoring crop moisture, guiding irrigation decisions, and catching early signs of drought. However, measuring these indices requires special sensors typically available on advanced drones or satellite systems such as Landsat and Sentinel-2.
Indices for Identifying Nutrient Deficiencies
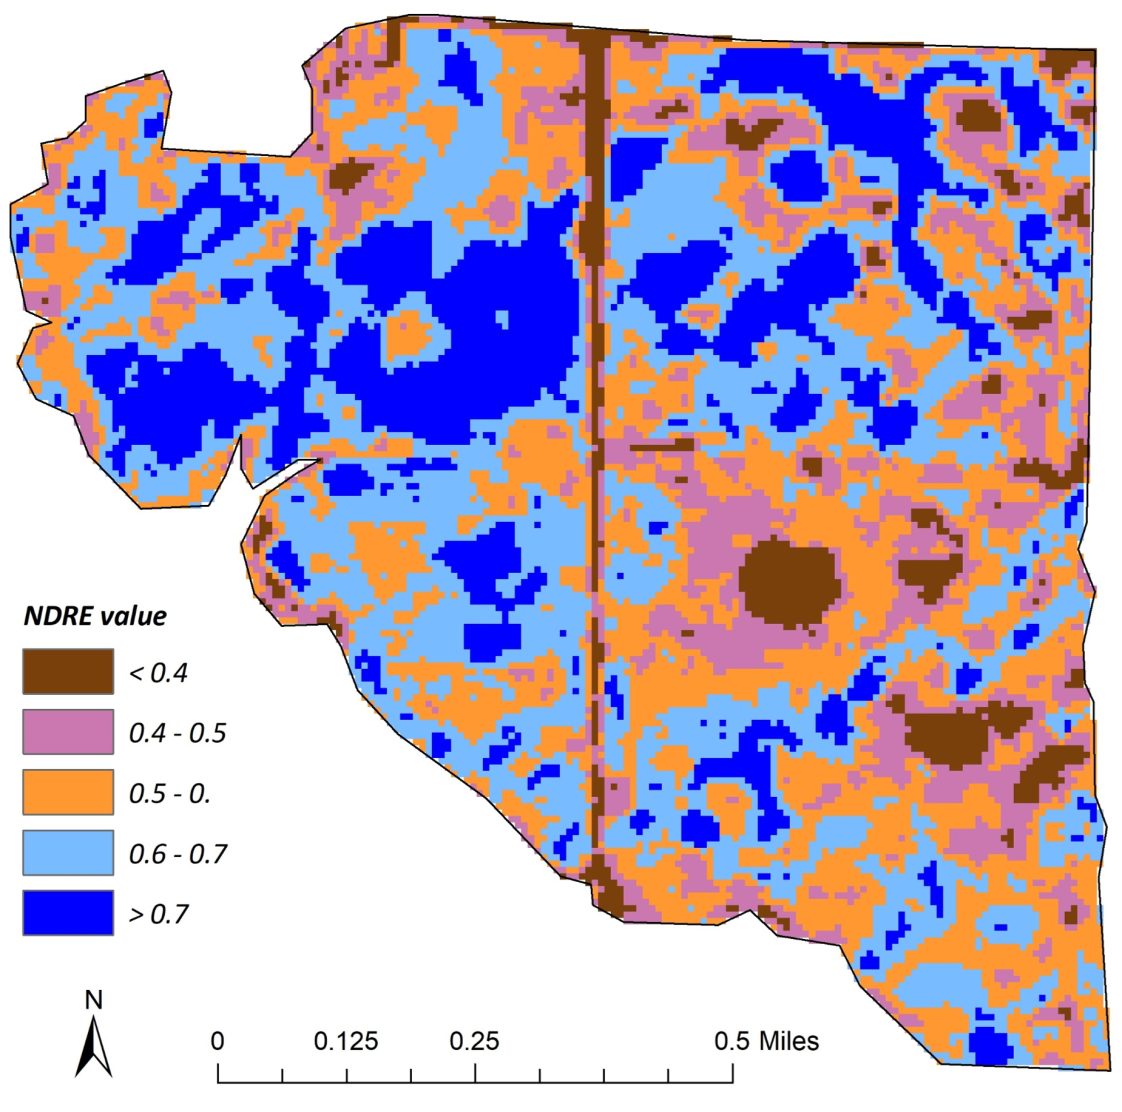
Figure 3. Visualization of crop health analysis using Normalized Difference Red Edge (NDRE) from Sentinel-2 data, where blue represents healthy vegetation, orange and purple indicate increasing stress, and brown identifies severely stressed or sparse canopy (bare soil).
Remote sensing vegetation indices (VIs) are also valuable for identifying crop nutrient deficiencies, such as low levels of nitrogen, magnesium, or iron. These indices allow farmers or agronomists to quickly assess plant nutrient status over large areas and make better-informed decisions without damaging the crops. A particularly effective tool for detecting nutrient deficiencies is the Normalized Difference Red Edge (NDRE) index. NDRE uses the red edge spectral band (700–730 nm), a transition zone between red and near-infrared light where chlorophyll absorption is highly responsive to changes in plant nutrition. Since nitrogen availability and chlorophyll production are closely related, NDRE is particularly useful for identifying nitrogen stress, especially in the mid-to-late development stages when conventional indices like NDVI lose some of their sensitivity. Readings below 0.2 are clear signs of nitrogen deficiency, but NDRE readings in healthy crops typically fall between 0.3 and 0.6. Figure 3 shows how healthy the crops are in different parts of the field, using NDRE values. The brown and purple areas mean that the plants in those areas might not be getting enough nitrogen or are not growing well. The blue areas show healthier plants that are likely getting enough nitrogen and are doing better overall.
Complementing Normalized Difference Red Edge (NDRE), the Chlorophyll Content Index (CCI) provides a more direct estimation of leaf chlorophyll concentration. CCI provides an accurate metric for nutritional monitoring since chlorophyll reflects a plant’s capacity for photosynthetic activity and is highly reliant on sufficient nitrogen. While scores between 5 and 20 generally indicate a healthy nutritional state, low CCI levels—typically below 4—often suggest iron, magnesium, or nitrogen deficit.
Farmers can use spatial maps made from satellite data, drones, or high-resolution aerial surveys to spot differences in how crops are growing across their fields. These maps show areas that look healthy and areas that might be under stress. Farmers do not need to fly drones or manage the technology themselves; many of these services are easy to access online or through local agriculture providers. Tools like FieldView (Bayer), Cropwise (Syngenta), John Deere Operations Center, Farmers Edge, and Sentera provide this kind of imagery, updated throughout the season.
While these maps do not directly measure nutrients, they can help find problem areas where poor growth might be caused by low soil fertility. Instead of applying fertilizer evenly across the whole field, farmers can treat just the areas where inputs are needed. This approach improves crop growth and helps protect the environment by reducing extra nutrients from washing into streams or leaching into groundwater and lowering input costs.
Practical Implementation for Farmers
You do not need to be a technical expert to use these tools. Many vegetation indices (VIs) maps are already available through digital farming platforms such as FieldView (Bayer), Cropwise (Syngenta), John Deere Operations Center, or through local consultants and service providers. These services make it easy to view your fields from above and track changes throughout the season from your phone, tablet, or computer. Most of the time, crop consultants, agronomists, or agriculture service providers collect and analyze the data. They share simple maps and recommendations with the grower to help guide field decisions. Here’s how VIs are used in modern farming:
- Satellite images (e.g., Sentinel-2, Landsat) are great for general monitoring and trend analysis over large areas. Each pixel in a satellite image typically represents 10 to 30 meters (about 33 to 98 feet) on the ground, so smaller issues such as small weed patches or nutrient streaks, might not be visible.
- For closer inspections, drones with multispectral cameras can take high-resolution images at 1 to 10 centimeters per pixel (roughly 0.4 to 4 inches) making it possible to pinpoint stress areas.
- For confirming drone or satellite data, handheld spectrometers offer immediate, ground-level measurements while you are in the field.
It is important to recognize that vegetation index (VI)values naturally fluctuate throughout a crop’sgrowth cycle. Early in the season, low values arecommon simply because the plants are small andhave not developed much green leaf area, and notnecessarily due to stress. As the crop grows andthe canopy becomes denser, VI values typicallyrise, peaking around flowering when leaf coverageis at its maximum. Later, as the crop matures and enters senescence, these values decline. Understanding this natural progression helps prevent misinterpretation of the data.
Vegetation indices (VIs) are most useful when analyzed over time rather than through isolated readings. Establishing baseline VIs values for healthy crops at different growth stages allows farmers to detect meaningful deviations. To ensure accurate interpretation, it is essential to cross-reference these trends with on-the-ground observations such as soil moisture levels, leaf tissue analysis, or pest scouting. For example, low Normalized Difference Red Edge Index (NDRE) values combined with yellowing leaves may indicate nitrogen deficiency, while low Normalized Difference Moisture Index (NDMI) readings alongside dry soil point to drought stress. While these tools do not replace field scouting or expert agronomic advice, they offer a powerful way to monitor crop health efficiently and focus resources where they are needed most.
Conclusion
Farmers can use vegetation index (VI) maps to better identify and manage crop stress. These maps use spectral data from satellites or drones to highlight areas of concern. Consistent monitoring of indices such as the Normalized Difference Vegetation Index (NDVI) (for overall crop health), the Normalized Difference Moisture Index (NDMI) (for water status), and the Normalized Difference Red Edge Index (NDRE) (for nitrogen levels) enables growers to optimize irrigation, fertilization, and pest management, ultimately improving yields while reducing input costs.
As climate variability continues to rise, integrating remote sensing data into daily farm operations is becoming increasingly essential. For identifying water stress, Shortwave infrared (SWIR)-based indices like the Normalized Difference Moisture Index (NDMI) and the Moisture Stress Index (MSI) are particularly effective. When monitoring nutrient levels, indices such as the Normalized Difference Red Edge Index (NDRE) or the Chlorophyll Content Index (CCI) are more appropriate, while the Normalized Difference Vegetation Index (NDVI) and the Green NDVI (GNDVI) offer a broad overview of overall plant health.
Farmers are encouraged to start with user-friendly digital agriculture platforms that already include built-in satellite imagery tools like FieldView by Bayer, Cropwise by Syngenta, and Farmers Edge that make it easy to view crop health maps without needing to process images yourself.
For those comfortable with technology and eager to explore further, free satellite data platforms like Sentinel Hub offer a great starting point for learning about remote sensing and gaining an initial view of crop conditions. These freely available images provide valuable insights into vegetation health and can help pinpoint areas in the field that may need attention.
To spot small, localized issues, drone imagery offers high-resolution detail that satellite images may miss. Regardless of the source, it is essential to confirm what you see in imagery with on-the-ground checks like soil sampling or tissue tests before taking action. Keeping records of vegetation index (VI) trends over the season also helps improve decisions year after year by showing how your crops respond to different practices or conditions. By combining remote sensing with field knowledge, farmers can move from reactive to proactive management, leading to healthier crops, more efficient input use, and ultimately greater profitability.
References
- Agati, G., Foschi, L., Grossi, N., Guglielminetti, L., Cerovic, Z. G. & Volterrani, M. (2013). Fluorescence-based versus reflectance proximal sensing of nitrogen content in Paspalum vaginatum and Zoysia matrella turfgrasses. European Journal of Agronomy, 45, 39–51.
- Boiarskii, B. & Hasegawa, H. (2019). Comparison of NDVI and NDRE indices to detect differences in vegetation and chlorophyll content. Journal of Mechanics of Continuous Mathematical Sciences, 4(1), 20–29.
- Ceccato, P., Flasse, S., Tarantola, S., Jacquemoud, S.& Grégoire, J. M. (2001). Detecting vegetation leafwater content using reflectance in the optical domain.Remote Sensing of Environment, 77(1), 22–33.
- Gao, B. C. (1996). NDWI—A normalized difference water index for remote sensing of vegetation liquid water from space. Remote Sensing of Environment, 58(3), 257–266.
- Gitelson, A. A., Kaufman, Y. J. & Merzlyak, M. N. (1996). Use of a green channel in remote sensing of global vegetation from EOS-MODIS. Remote Sensing of Environment, 58(3), 289–298.
- Hatfield, J. L., Gitelson, A. A., Schepers, J. S. & Walthall, C. L. (2008). Application of spectral remote sensing for agronomic decisions. Agronomy Journal, 100(Supplement_3), S117–S131.
- Huete, A., Didan, K., Miura, T., Rodriguez, E. P., Gao, X. & Ferreira, L. G. (2002). Overview of the radiometric and biophysical performance of the MODIS vegetation indices. Remote Sensing of Environment, 83(1–2), 195–213.
- Liu, Q., Zhang, J., Zhang, H., Yao, F., Bai, Y., Zhang, S., Meng, X. & Liu, Q. (2021). Evaluating the performance of eight drought indices for capturing soil moisture dynamics in various vegetation regions over China. Science of the Total Environment, 789, 147803.
- Mulla, D. J. (2013). Twenty-five years of remote sensing in precision agriculture: Key advances and remaining knowledge gaps. Biosystems Engineering, 114(4), 358–371.
- Rouse, J. W., Haas, R. H., Schell, J. A. & Deering, D. W.(1974). Monitoring vegetation systems in the GreatPlains with ERTS. In Proceedings of the Third EarthResources Technology Satellite-1 Symposium.
- Sishodia, R. P., Ray, R. L. & Singh, S. K. (2020). Applications of remote sensing in precision agriculture: A review. Remote Sensing, 12(19), 3136.
 Anh Nguyen, Postdoctoral Fellow; Arpita Sharma, Postdoctoral Fellow; and Rishi Prasad, Extension Specialist, Associate Professor, all in Crop, Soil, and Environmental Sciences, Auburn University
New August 2025, Understanding Vegetation Indices Used in Precision Agriculture, ANR-3180