Crop Production
The right balance of phosphorus is vital to plant health. Learn deficiency symptoms, tissue sufficiency ranges, and common phosphorus sources.
Phosphorus (P) is an essential nutrient required for plant growth. It is the second most limiting macronutrient after nitrogen (N). Inadequate P nutrition delays plant maturity and reduces yields.
Functions of Phosphorus in Plants
Phosphorus in plants is key in capturing, storing, and converting the sun’s energy into biomolecules, such as adenosine triphosphate (ATP), that drive biochemical reactions (e.g., photosynthesis) from germination through the formation of grain to maturity. Phosphorus is present in deoxyribonucleic acid (DNA) and ribonucleic acid (RNA), which store information on how plants should perform routine functions such as synthesizing proteins, lipids, and nucleic acid and metabolizing sugars. Phosphorus promotes early root growth, winter hardiness, and seed formation, stimulates tillering, and increases water use efficiency.
Phosphorus Deficiency in Plants
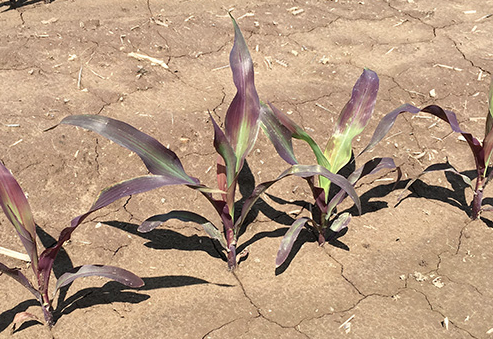
Figure 1. Phosphorus deficiency in corn. Leaves are purplish and tips are brown and necrotic. (Photo credit: Gregory A Luce, University of Missouri)
Phosphorus deficiency in plants can be visually identified at the early vegetative stage as an abnormally dark green or reddish purple color along the edge of the lower plant leaves (figure 1). Most phosphorus deficiencies are observed in early spring in low pH soils (pH < 5) or in fields with low soil test phosphorus value. Dry soil conditions also can induce phosphorus deficiency in young plants.
In high phosphorus soils, deficiency may be observed during cold temperatures, especially in early spring. Cold temperatures retard root growth and reduce the phosphorus uptake in plants. Symptoms diminish, however, as the soil warms up. Factors such as soil compaction, herbicide injury, insect pressure, and poor soil health also can cause phosphorus deficiency.
Plant Tissue Phosphorus Sufficiency Ranges
Plant tissue analysis can serve as a valuable tool to diagnose phosphorus deficiency or other potential fertility problems. While soil testing is performed to predict the nutrient availability in soils, plant tissue analysis provides information on the nutrients taken up by the plants.
The phosphorus concentration in plant tissue might be in deficiency range, sufficiency range, or excess range. Tissue phosphorus in the deficiency range causes yield reduction when soil test P is low. Sufficiency range of phosphorus varies with the plant’s age and will produce a maximum yield without additional phosphorus application (provided there is no other limiting factor). Excess levels of phosphorus in plant tissue may not affect yield but may induce iron, zinc, or manganese deficiencies.
The sufficiency range of phosphorus for various crops is presented in table 1. The sufficiency range of phosphorus varies among crop, plant part, and growth stage.
Table 1. Sufficiency Range of Tissue Phosphorus for Various Crops
*Adapted from Southern Cooperative Series Bulletin no. 394
| Crop | Growth Stage | Plant Part Used for Tissue Testing | P Sufficiency range (%) |
|---|---|---|---|
| Corn | Seedling (< 4 inches in height) | Whole plant | 0.40‒0.60% |
| Corn | > 4 inches in height to tasseling | Most recent mature leaf | 0.30‒0.50% |
| Corn | Tasseling / bloom | Ear leaf | 0.25‒0.50% |
| Corn | Maturity | Ear leaf | 0.25‒0.40% |
| Small grains (barley, oats, rye, wheat) | Seedling to tiller | Whole plants | 0.20‒0.50% |
| Small grains (barley, oats, rye, wheat) | Jointing to flag leaf emergence | Top 2 or 3 leaves (growing point) | 0.20‒0.50% |
| Small grains (barley, oats, rye, wheat) | Flag leaf to maturity | Flag leaves | 0.20‒0.50% |
| Soybean | Early growth | Most recently mature leaf blades | 0.30‒0.60% |
| Soybean | Flowering | Most recently mature leaf blades | 0.30‒0.60% |
| Cotton | Early bloom | Uppermost mature cotton leaf blade on the vegetative stem | 0.20‒0.65% |
| Cotton | Late bloom / maturity | Uppermost mature cotton leaf blade | 0.15‒0.60% |
| Canola | Prior to flowering | Recently mature leaf blades | 0.42‒0.69% |
| Peanuts | All growth stages | Whole aboveground portion of plant | 0.20‒0.50% |
| Alfalfa | Bud to 10% bloom | 4 to 6 inches of the plant | 0.25‒0.70% |
| Bermuda | Before heading | Upper half of the plant | 0.20‒0.40% |
| Fescue | Before flowering | Aboveground plant | 0.26‒0.40% |
Sources of Phosphorus for Plant Nutrition
Phosphorus is present in soil in organic and inorganic forms. However, the amount of phosphorus available for plant uptake is very low compared to the total amount of phosphorus present in the soil. For example, total soil phosphorus may be 800 pounds per acre, but the plant available amount in soil solution might be 0.04 to 0.13 pounds per acre. For a description of phosphorus forms in soil, see “Phosphorus Basics: Understanding Phosphorus Forms and Their Cycling in the Soil”(Extension publication ANR-2535).
Plants take up phosphorus from soil solution in two forms only: H2PO4– or HPO42-, commonly referred to as orthophosphates. Orthophosphates are very reactive and can form stable complexes by binding with iron, aluminum, calcium, or magnesium that may be present in the soil.
Availability of orthophoshates also depends on soil pH and is greatest when soil pH values are between 6 and 7.5. The lack of available phosphorus in soil solution necessitates phosphorus applications via organic sources such as manure or inorganic sources such as synthetic fertilizers.
Inorganic Fertilizer
Phosphorus in commercial fertilizers is expressed in oxide form (P2O5) rather than the elemental form. This system of expressing phosphorus as oxide is conventional shorthand. For example, a 50-pound fertilizer bag labeled 18-46-10 represents 9 pounds of N (18 percent of the 50 pounds), 23 pounds of P2O5 (46 percent of the 50 pounds) and 5 pounds of K2O (10% of 50 pounds). To convert P2O5 to elemental phosphorus % and vice versa, use the following conversion formula:
% P2O5 → Multiply by 0.44 → % P
% P → Multiply by 2.3 → % P2O 5
Several inorganic phosphorus fertilizers are available that differ in nutrient analysis. While one phosphorus fertilizer product might work better than the other in certain situations, the phosphorus recommendations are the same regardless of the P fertilizer source. Nutrient analysis of some common phosphorus fertilizers are presented in tables 2 (inorganic sources) and 3 (organic sources).
Table 2. Nutrient Content of Common Inorganic Phosphorus Sources in Percentages
N = nitrogen; P2O5 = phosphate; K2O = potash; Ca = calcium; Mg = magnesium; S = sulfur
Source: ‟Nutrient Content of Fertilizer Materials” (Extension publication ANR-0174)
| Inorganic Source | N | P2O5 | K2O | Ca | Mg | S | Comments |
|---|---|---|---|---|---|---|---|
| Normal superphosphate | 0 | 20 | 0 | 21 | 0 | 11 | No longer used in crop production |
| Concentrated superphosphate (triple superphosphate); Ca(H2PO4)2 × H2O | 0 | 46 | 0 | 14 | 0 | 2 | Used mostly in no-nitrogen blends |
| Ammoniated superphosphate | 12-17 | 22-35 | 0 | * | 0 | * | |
| Monoammonium phosphate (MAP); NH4HPO4 | 11 | 48 | 0 | 1 | 0 | 0 | Excellent source for starter fertilizer |
| Diammonium phosphate (CAP); (NH4)2H2PO4 | 18 | 46 | 0 | 0 | 0 | 0 | Common phosphorus fertilizer |
| Ammonium polyphosphate; (NH4)HP2O7 + (NH4)5P3O10 | 10 | 34 | 0 | 0 | 0 | 0 | Liquid form. Very common source of liquid P fertilizer |
| Phosphate rock | 0 | 2-35 | 0 | * | * | 0 | Very low water solubility. Total P2O5 relatively unavailable |
Table 3. Nutrient Content of Common Organic Phosphorus Sources in Approximate % Values
*Present in insignificant amounts
N = nitrogen; P2O5= phosphate; K2O = potash; Ca = calcium; Mg = magnesium; S = sulfur
Source: "Nutrient Content of Fertilizer Materials” (Extension publication ANR-0174)
| Manure (dried) | N | P2O5 | K2O | Ca | Mg | S |
|---|---|---|---|---|---|---|
| Cattle | 1.5 | 1.5 | 1.2 | 1.1 | 0.3 | * |
| Horse | 0.4 | 0.2 | 0.3 | * | * | * |
| Poultry Broiler litter | 3 | 3 | 2 | 1.8 | 0.4 | 0.3 |
| Poultry Hen-caged layers | 1.5 | 1.3 | 0.5 | 6 | 0.4 | 0.3 |
| Poultry Hen litter | 1.8 | 2.8 | 1.4 | * | * | * |
| Sheep | 0.6 | 0.3 | 0.2 | * | * | * |
| Swine | 0.6 | 0.4 | 0.1 | * | * | * |
Commercial phosphorus fertilizers differ in their ability to dissolve in water. When a phosphorus fertilizer sample is dissolved in water, a percentage of the total phosphate dissolves in the water while the remaining phosphorus dissolves in ammonium citrate solution. The percentage of phosphate dissolved in water is referred to as water-soluble phosphate; the percentage dissolved in ammonium citrate solution is referred to as citrate-soluble phosphate.
The sum of the water-soluble and citrate-soluble phosphates is the amount guaranteed on the fertilizer label and is considered plant available. The citrate-soluble phosphorus is usually a minor amount compared to water-soluble phosphorus.
The first commercial phosphorus fertilizer was superphosphate and triple superphosphate (table 2). Ordinary superphosphate is no longer used in crop production.
The most common phosphorus fertilizers currently used are monoammonium phosphate (MAP, 11-48- 0), diammonium phosphate (DAP, 18-46-0), and polyphosphate.
Monoammonium phosphate contains 82 percent water- soluble phosphate. It rapidly releases phosphorus in moist soils and is most commonly used as a starter fertilizer.
Diammounium phosphate contains 90 percent water-soluble phosphate. The application of MAP creates a temporary acidic zone (pH of 3.5‒4.5) surrounding the granules. Conversely, application of DAP creates a temporary alkaline condition (pH of 7.8‒8.2) around the granules. Application of DAP in calcareous soils or high pH soils may cause seedling damage if used as a starter fertilizer or banded in high concentration near roots. Although these soil pH changes occur after application of MAP or DAP, the effects lessen over time and do not affect plant growth and yield.
Polyphosphate is a liquid fertilizer and contains two forms of phosphorus: orthophosphate and polyphosphate. Orthophosphate is readily available to crops; polyphosphate needs to convert into orthophosphate before plants can take it up. Enzymes produced by soil microorganisms break down the polyphosphates into the usable form. Common polyphosphate fertilizers are the crystal-free fluids 10-34-0 or 11-37-0.
Organic Phosphorus Sources
The most common sources of organic phosphorus for crops are animal manure, compost, or sewage sludge. Phosphorus content of organic sources varies, and the release of P is slow and variable.
The phosphorus content of manure varies with diet of the animal, animal species, handling and storage of manure, type of bedding material, and, in the case of poultry litter, the number of flocks between cleanout. For example, broiler litter may contain 60 pounds P2O5 per ton whereas beef cattle manure may contain only 30 pounds P2O5 per ton. For a description of factors affecting the nutrient composition of poultry litter, refer to “Nutrient Content and Composition of Poultry Litter” (Extension publication ANR-2522).
Phosphorus in manure is mostly in organic form and must break down into plant-available form. This process is slow and is accomplished by soil microbes. Manures also are excellent sources of other nutrients, such as calcium, magnesium, zinc, and sulphur.
Manure application should be carefully managed since the relative amount of nutrients required by each crop is different compared to the relative amount of nutrients present in the manure. For example, applying manure as the main source of nitrogen for corn will result in three- to four-fold excess application of phosphorus over the amount typically required by the plant. Additionally, if manure is applied annually, soil phosphorus will build up quickly in a few years.
From a nutrient management standpoint, the source of phosphorus does not matter; however, what separates different sources is their ability to release phosphorus and increase the availability of phosphorus in soil solution for plant uptake. Two tons of chicken litter (3-3-2) will provide the same amount of phosphorus as 260 pounds of DAP; however, the phosphorus availability will differ between these two sources. Because this is a biological process, chicken litter P will be slowly available as compared to DAP.
 Debolina Chakraborty, Research Fellow, and Rishi Prasad, Extension Specialist, Assistant Professor, both in Crop, Soil, and Environmental Sciences, Auburn University
Reviewed October 2021, Phosphorus Basics: Deficiency Symptoms, Sufficiency Ranges, and Common Sources, ANR-2588