Crop Production
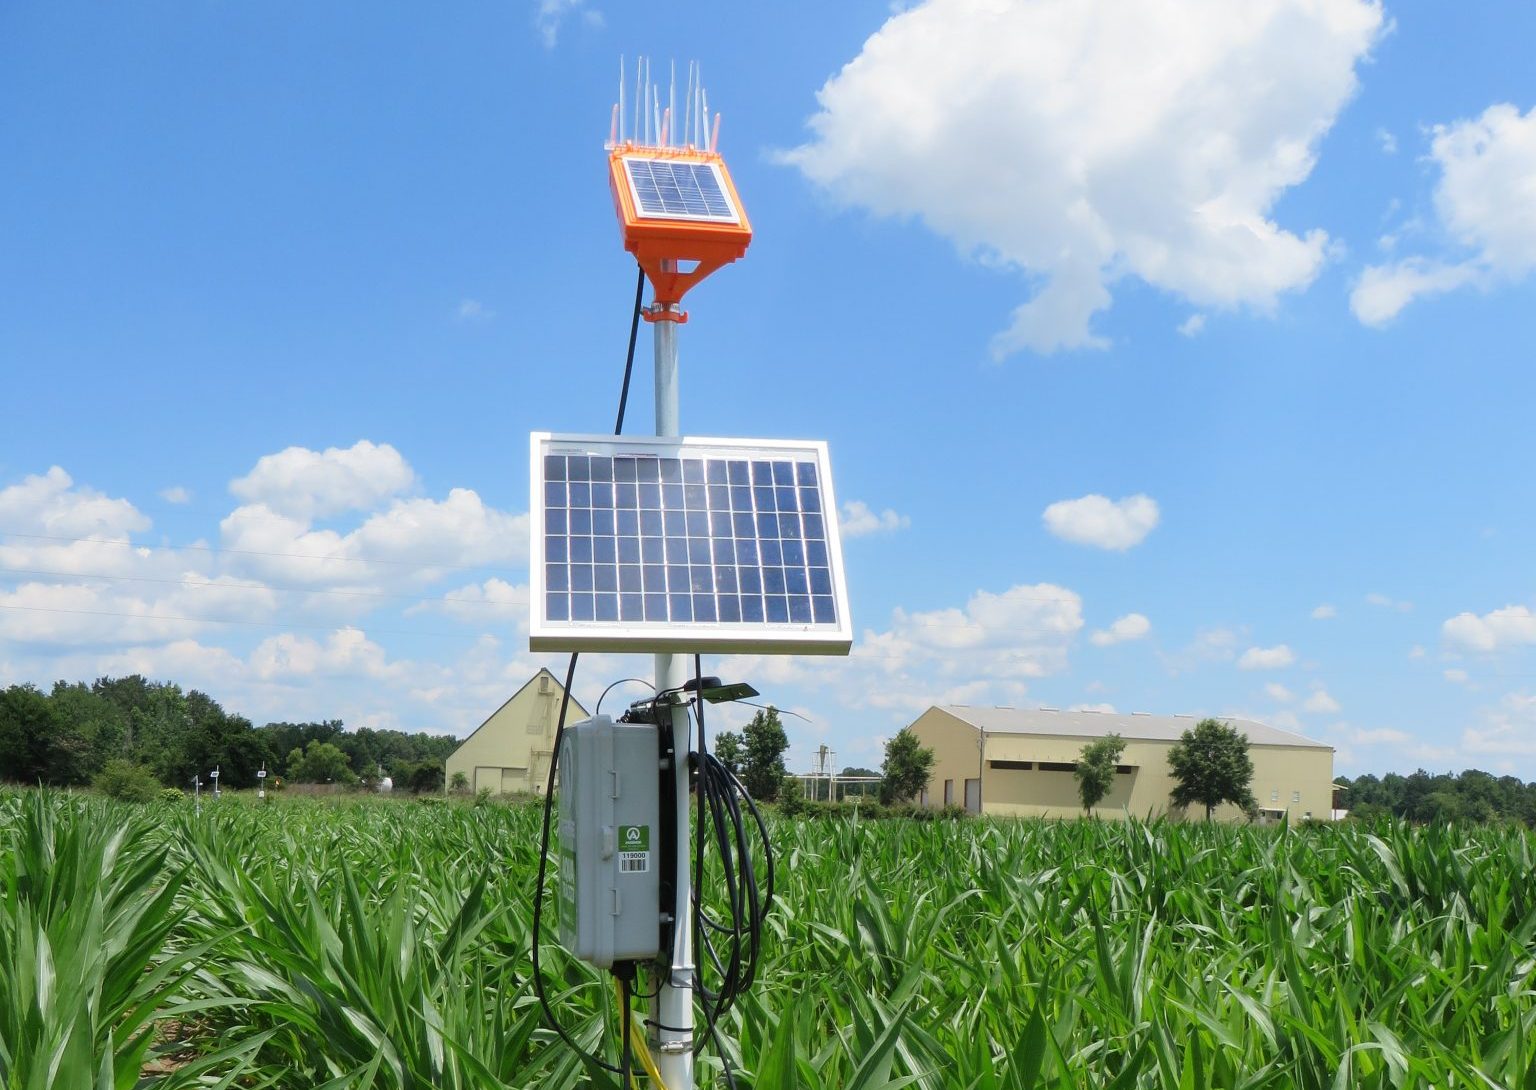
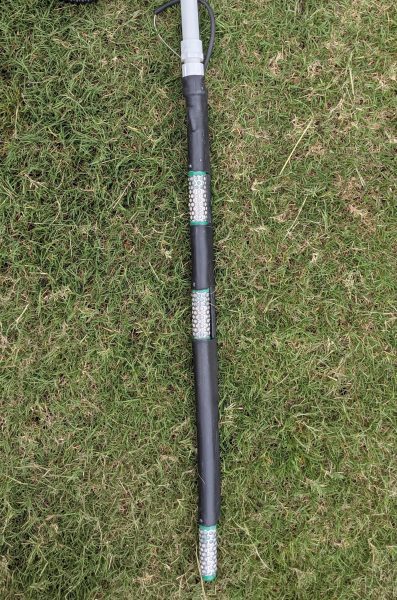
Figure 1. Probe containing three soil water tension sensors.
Soil water tension sensors are an effective tool in irrigation management, enabling producers to monitor soil water during the growing season and improve irrigation timing. Guidelines for collecting and interpreting sensor data are covered.
Determining irrigation timing and rate is not an easy task. The amount of water a soil can hold is influenced by many factors, such as soil texture and soil organic matter. These factors affect the relationship between crop water demand and weather conditions, ultimately influencing irrigation decisions.
Advances in research, sensing, and computing technology have resulted in development of irrigation scheduling tools to make irrigation decisions easier for farmers. Among the most used tools are soil water matric potential sensors, or soil water tension sensors (figure 1). These sensors deliver data that relate tension values to crop-available water.
This article provides guidelines for collecting and interpreting soil water tension data for irrigation purposes. The triggering values used are based on predefined irrigation amounts for major agronomic soil types found in northwest and southeast Alabama.
Relationship Between Soil Water Tension and Soil Water Status
Soil water tension (SWT) is defined as the water pressure of a soil at a particular time, usually measured in kiloPascals (kPa) or centibars (cb). This pressure represents the amount of force required to extract water from its pores. For example, when soil is wet, the force required to extract water is low, but when the soil is dry, the force required is high. For irrigation purposes, there are four main soil water conditions used as guidelines (figure 2):
Saturation. Soil pores are fully filled with water. SWT = 0 kPa.
Field capacity. Soil has reached the maximum amount of water it can hold. Under this status, excess water has drained, and a portion of the soil pores are filled with air. The force required for the plant root system to uptake water at this status is very small. The SWT at field capacity changes from soil to soil and is dependent on many soil characteristics, particularly soil texture. SWT at field capacity ranges from 10 kPa (light soil texture) to 33 kPa (heavy soil texture).
Permanent wilting point. Soil has reached the water level at which plants can no longer extract water from it. SWT = 1,500 kPa.
Irrigation trigger. Soil is at the maximum allowable SWT value at which available moisture is not limiting crop development. At this level, irrigation should be started to prevent water stress.
SWT = variable based on each soil type.
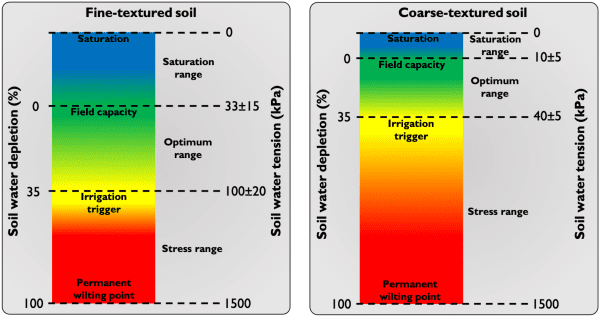
Figure 2. Relationship between soil water tension and soil water depletion and the different water levels used for irrigation purposes in fine-textured soil (left) and coarse-textured soil (right).
Based on the relationship between SWT and available soil water, it is possible to define three ranges of soil water level: saturation, optimum, and stressed. An example of this relationship is shown in figure 2.
As plants extract water from the soil or water is lost by evaporation or deep percolation, the soil water level begins to deplete. This is how soil water level relates to soil water depletion (SWD). The saturation range goes from SWT of 0 kPa to SWT at field capacity. At field capacity, SWD is equal to 0 percent. The optimum range goes from field capacity to the irrigation trigger.
Some previous studies suggest that high irrigation water-use efficiency and high crop yield can be achieved when irrigation starts at 35 percent SWD. To achieve these efficiencies at this timing, the amount of irrigation to be applied should be calculated to bring soil water level back to field capacity (0 percent SWD). At 35 to 100 percent SWD, soil falls within the water stress range. At this range, the available soil water for the plants is limited, and yield losses are expected to occur.
Depending on the irrigation system and the irrigation depth, it may take several days for an irrigation event to be completed. For example, a seven-span-length center pivot could take 4 days for a full revolution when applying an irrigation amount of 1 inch. If the irrigation system takes a long time to cover the field, the expected delay in application must be accounted for to prevent plants from experiencing water stress in the time it takes for the irrigation system to cover the entire field.
Most of the heavy- and light-textured soils will show SWT values at field capacity of 33 and 10 kPa, respectively, and irrigation trigger points of 100 and 40 kPa, respectively. These differences are due mainly to the soil physical properties and their ability to hold water (figure 2).
The amount of water that a soil can hold is determined by the difference between volumetric soil moisture at field capacity and permanent wilting point. Heavy- textured soils present a soil water holding capacity in the order of 1.5 to 2 inches per foot of soil, while light- textured soil holds much less water, in the order of 0.8 to 1 inch per foot of soil.
Using Soil Water Tension Sensors to Track Soil Water Status
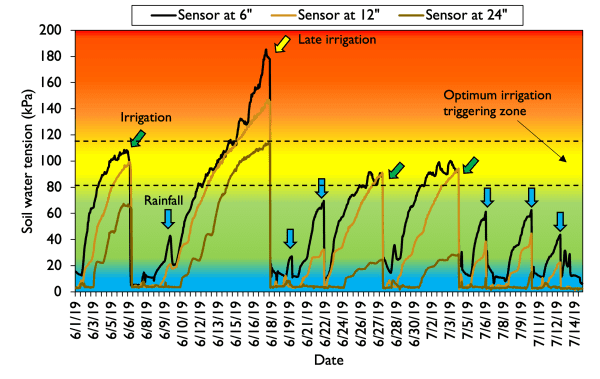
Figure 3. Dynamic soil water tension values over the period of peak water demand for corn (R1 to R5) at soil depths of 6, 12, and 24 inches for a cornfield cultivated on a silty clay loam soil in northwestern Alabama. Irrigation is represented by green arrows and rainfall by blue arrows.
One of the main benefits of using SWT sensors, like Watermarks, is the ability to track the changes in soil moisture throughout the soil profile. An example of Watermark sensor readings at the peak of crop water demand for corn is given in figure 3. Watermark sensors cover soil water tension within a range of 0 to 200 kPa. After a rainfall event, the soil will become wet and the SWT sensor will report readings close to 0 kPa. As water begins to be extracted from the soil by plants or begins moving to deeper portions of the soil profile, the SWT increases continuously until another irrigation or rainfall event occurs.
Tracking SWT from multiple soil depths helps to identify different water levels throughout the soil profile. In figure 3, for example, the sensor located at a 6-inch soil depth was consistently drier than the other sensors (higher SWT values), which was expected since this sensor is located where a larger percentage of corn roots extract water from the soil. On the other hand, the soil sensor located at a 24-inch soil depth was kept wet during most of the period analyzed and therefore registered lower SWT values.
This type of soil sensor also can be used to determine the depths of the soil profile affected by a rainfall or irrigation event. Figure 3 shows that on June 9 a small change of SWT was registered only at the Watermark sensor located at 6 inches. This was due to a small rainfall (0.1 inch) that did not reach deeper soil layers. Because of delayed irrigation that occurred on June 18, which was within the peak period of water demand, SWT increased exponentially and went above the irrigation trigger threshold.
Triggering Irrigation with Soil Water Tension Sensors
The SWT values provided in figure 2 can be used as a good approximation of irrigation scheduling for most of the heavy- and light-textured soils found in Alabama. Because most producers use the same irrigation rate every time they start their irrigation system, we have estimated average SWT values corresponding to irrigation rates most commonly used by Alabama producers (table 1). To use, simply search for an irrigation rate and find the SWT value that should be used to start irrigation. This table also provides the corresponding soil water depletion level to each average soil tension value by soil type. More accurate irrigation decisions can be made using specific SWD levels and the respective SWT values.
Table 1 provides values of irrigation depth that should be applied to bring the soil back to field capacity based on a range of observed average SWT values. Note that the values provided on both tables correspond to irrigation depths of 24 inches.
For example, if an irrigation depth of 0.6 inch is the preferable and commonly used rate by the farmer, irrigation should be initiated when SWT from the soil sensor reaches 77 and 38 kPa for Decatur (silty clay loam) and Alpin (sand) soil types, respectively (table 1).
Table 1. Soil Water Tension (SWT) Value and Corresponding Soil Water Depletion (SWD) for Various Predefined Irrigation Depths*
bValues calculated for a 24-inch soil profile depth.
*Additional field validation of these thresholds is required.
| Irrigation Depth (inchb) | Decatura (silty clay loam) SWT (kPa) | Decatura (silty clay loam) SWD (%) | Alpina (sand) SWT (kPa) | Alpina (sand) SWD (%) |
|---|---|---|---|---|
| 0.25 | 46 | 13 | 20 | 18 |
| 0.3 | 50 | 15 | 22 | 20 |
| 0.5 | 67 | 23 | 32 | 31 |
| 0.6 | 77 | 27 | 38 | 36 |
| 0.75 | 96 | 33 | 50 | 44 |
| 1.0 | 142 | 43 | 84 | 56 |
Note that depending on the soil type, maintaining the same irrigation depth may not be a good irrigation practice. For example, if a producer prefers to use a 1-inch irrigation depth, then waiting for a sandy soil like Alpin to reach 1 inch of depletion will result in an SWD value of 56 percent, likely causing plant water stress. It is therefore recommended that the irrigation depth be adjusted in a way that irrigation is initiated before SWD reaches 50 percent.
To help producers determine how much to irrigate based on SWT values, table 2 lists recommended irrigation depths in relation to a range of SWT values. This information can be used to identify irrigation needs for a given average SWT value within the first 24 inches of soil depth.
Considering a maximum allowable SWD of 35 percent and a 24-inch soil profile depth, the recommended SWT irrigation trigger for Decatur and Alpin soil types is 100 and 35 to 40 kPa, respectively. These differences in SWT irrigation trigger values among soil types are due to the differences in plant-available water, which is associated with soil texture. Because Alpin soil type has larger sand content, the soil holds less water compared to Decatur soil type, which have greater clay content. The values presented in table 2 are a great example of why irrigation should be managed differently from soil to soil to prevent over- or under-irrigation.
Table 2. Irrigation Depth and Corresponding Soil Water Depletion for Various Soil Water Tension Values
b Recommended soil water tension trigger value based on 35 percent soil water depletion and weighted average soil profile depths of 6, 12, and 24 inches.
| SWT (kPa) | Decatura (silty clay loam) Irrigation Depth (inch) | Alpina (sand) Irrigation Depth (inch) |
|---|---|---|
| 20 | - | 0.28 (20) |
| 30 | 0.06 (4) | 0.53 (34) |
| 40 | 0.18 (10) | 0.68 (41) |
| 50 | 0.31 (15) | 0.79 (47) |
| 60 | 0.42 (20) | 0.86 (51) |
| 70 | 0.52 (24) | 0.93 (54) |
| 80 | 0.61 (28) | 0.99 (56) |
| 90 | 0.69 (31) | 1.03 (59) |
| 100 | 0.76 (35) | 1.08 (61) |
| 110 | 0.83 (36) | 1.12 (62) |
| 120 | 0.89 (39) | 1.15 (64) |
| 130 | 0.94 (41) | 1.19 (66) |
| Recommended SWT triggering (kPa)b | 100 | 35-40 |
Calculating Average of Soil Water Tension Using Multiple Soil Sensor Data
To assess plant water uptake from the crop root system, installation of soil sensors at several soil depths is recommended for irrigation scheduling (figure 1). For example, for corn cultivated in the humid climate conditions of the southeast United States, monitoring soil water changes at 6, 12, and 24 inches allows coverage of more than 70 percent of the root profile. For other crops that have deeper root systems, SWT sensors can be installed at a soil depth of 30 or 36 inches. Because each sensor may cover different soil depths, the average of the SWT should be calculated based on the position of each sensor in the soil profile.
The equation below shows an example of how to calculate the average SWT, considering soil sensors installed at depths of 6, 12, and 24 inches. Note that the sensors at 6 and 12 inches have a higher weight factor than the sensors at 24 inches. This is because the top two sensors cover a higher portion of the soil profile considered for irrigation calculations.
Average SWT = SWT6” × 0.38 + SWT12” × 0.38 + SWT24” × 0.24
(SWT is soil water tension measured in kPa or cb)
The weighting factors given in the equation are suggested for corn, however, values may change for different crops and different locations. Weighting factors of 0.25, 0.25, and 0.5 are also an alternative when using soil sensors installed at depths of 6, 12, and 24 inches, respectively, and 0.17, 0.17, 0.33, and 0.33 when using soil sensors installed at 6, 12, 24, and 36 inches, respectively. Weighting factors of 0.5, 0.3, and 0.2 for cotton and 0.34, 0.33, and 0.33 for peanuts have been suggested for soil sensors installed at 8, 16, and 24 inches, respectively.
Figure 4 shows the changes of SWT values for two cornfields cultivated on a silty clay loam soil and on a sand soil. The values highlighted represent the moment at which irrigation occurred at both locations. These values were used for the calculation of the average SWT for the soil profile shown in table 3. This profile assumes 35 percent SWD and 24-inch soil profile depth based on common agronomic soils found in Alabama. The list is intended to help producers make irrigation decisions.
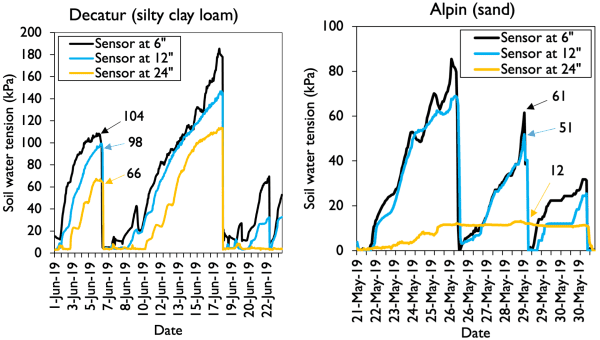
Figure 4. Dynamics of soil water tension values at soil depths of 6, 12, and 24 inches at two cornfields cultivated on a silty clay loam (left) and a sand soil (right). Black, blue, and orange arrows represent the soil water tension value for the soil sensor at 6, 12, and 24 inches, respectively.
Table 3. Calculation Process of Soil Profile*
* Average of soil water tension considering three soil depths and the corresponding irrigation depth based on the calculated soil water tension for a 24- inch soil profile depth.
| Soil Type | Soil Sensor Depth (inch) | Soil Water Tension (SWT) (kPa) | Weighting factor (WF) | SWT*WF (kPa) | Sum of SWT*WF (kPa) | Irrigation Depth (Based on Table 2) (inch) |
|---|---|---|---|---|---|---|
| Decatur (silty clay loam) | 6 | 104 | 0.38 | 39 | 92 | 0.7 |
| Decatur (silty clay loam) | 12 | 98 | 0.38 | 37 | 92 | 0.7 |
| Decatur (silty clay loam) | 24 | 66 | 0.24 | 16 | 92 | 0.7 |
| Alpin (sand) | 6 | 61 | 0.38 | 23 | 45 | 0.75 |
| Alpin (sand) | 12 | 51 | 0.38 | 19 | 45 | 0.75 |
| Alpin (sand) | 24 | 12 | 0.24 | 3 | 45 | 0.75 |
Conclusions
Understanding the relationship between soil water tension and available soil water is important to identify different soil water levels that can be used for irrigation purposes.
Tracking soil water tension using soil sensors is useful for identifying irrigation needs.
For a predefined irrigation depth, the soil water tension irrigation trigger changes from soil to soil.
References
- Butts, C. L., R. B. Sorensen, and M. C. Lamb. 2020. “Irrigator Pro: Progression of a Peanut Irrigation Scheduling Decision Support System.” Applied Engineering in Agriculture 36 (5): 785-795.
- Irmak, S., J. O. Payero, B. VanDeWalle, J. Rees, and G. Zoubek. 2014. “Principles and Operational Characteristics of Watermark Granular Matrix Sensor to Measure Soil Water Status and Its Practical Application for Irrigation Management in Various Soil Textures.” University of Nebraska-Lincoln Biological Systems Engineering.
- Rix, J., H. Lo, D. Gholson, and M. Henry. 2020. “Irrometer Watermark Series: Irrigation Triggers.” Extension Service of Mississippi State University Publication 3541: 10-20.
- Vellidis, G., V. Laikos, C. Perry, W. M. Porter, and M. A. Tucker. 2016. “Irrigation Scheduling for Cotton Using Soil Moisture Sensors, Smartphone Apps, and Traditional Methods.” 2016 Beltwide Cotton Conferences, New Orleans, LA.
- Web Soil Survey. n.d. Natural Resources Conservation Service, United States Department of Agriculture. http://websoilsurvey.sc.egov.usda.gov. Accessed 06/01/2021.
Funding
- Alabama Soil and Water Conservation Committee
- Alabama Agricultural Experiment Station production grant
- USDA-NRCS-CIG agreement no: 69-3A75-17-273
 Bruno Lena, Postdoctoral Fellow, Crop, Soil, and Environmental Sciences, Auburn University; Luca Bondesan, Visiting Scholar and Research Assistant; Brenda Ortiz, Extension Specialist, Professor, Crop, Soil, and Environmental Sciences, Auburn University; Guilherme Morata, Regional Extension Agent, Agronomic Crops, Auburn University; and Hemendra Kumar, PhD Candidate, Biosystems Engineering, Auburn University
New July 2021, Irrigation Scheduling Using Soil Water Tension Sensors, ANR-2774