Crop Production
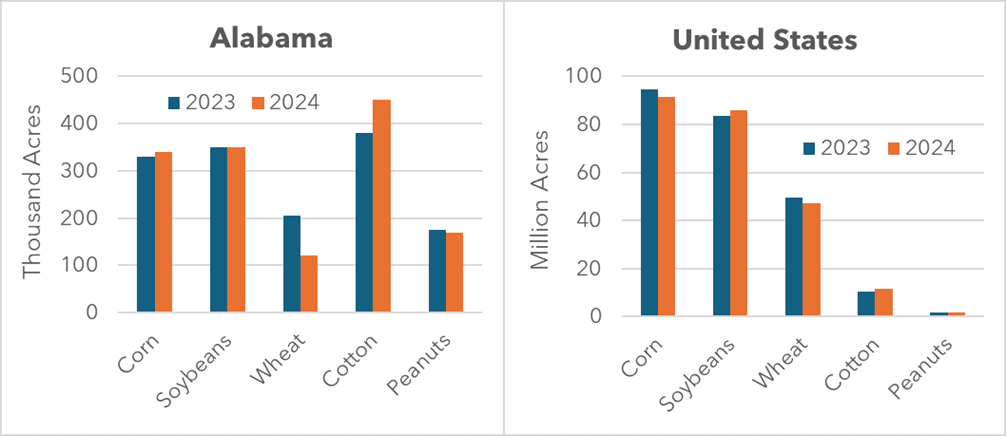
Figure 1. Alabama & US Crop Acres, 2023 vs. 2024
The first half of 2024 saw crop prices trend downwards. Around planting time, corn and cotton prices took a dive while soybean prices were turbulent. Production costs decreased from 2023 to 2024, but the uneven prices left us wondering what would be planted and how markets would be affected. The USDA Acreage and July World Agricultural Supply and Demand Estimates reports provide further guidance on what production may look like this year and how that may affect prices for the upcoming 2024/2025 marketing year.
Cotton
Alabama planted an estimated 450 thousand cotton acres in 2024, making it the most-planted crop in the state (figure 1). This marks a 20 thousand acre increase over what was projected in March. It is also an 18 percent increase from last year, which reflects the upward national trend. The United States as a whole had a 14 percent increase over 2023, with a 9 percent increase over what was predicted in March.
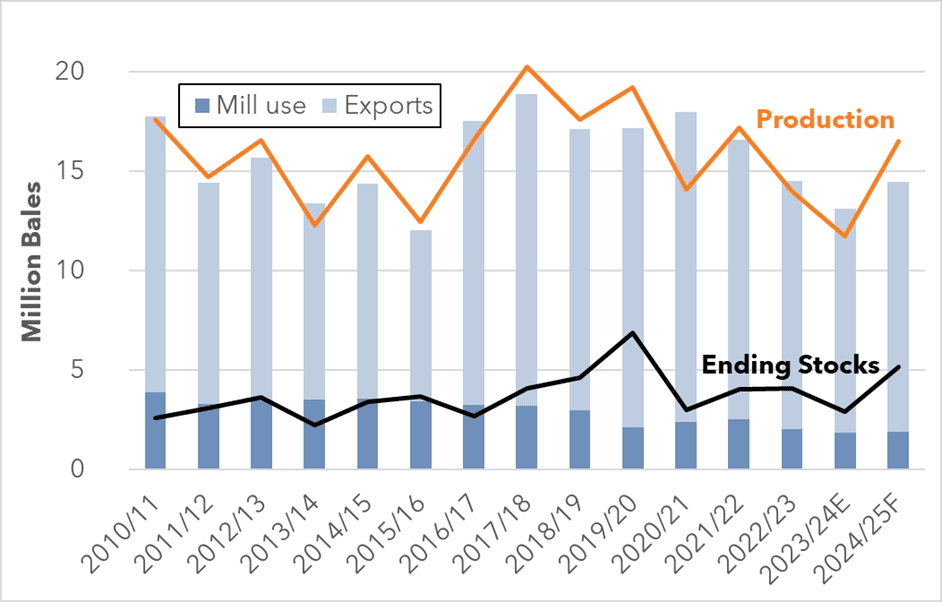
Figure 2. Cotton Supply, Demand, and Ending Stocks by Marketing Year
The increase in acreage is expected to lead to a significant increase in cotton production. However, it is important to keep in mind that acreage planted and harvested can differ tremendously for cotton, so the increased acreage does not guarantee high production. The past two years have seen only 63 and 53 percent of planted cotton acres harvested in 2023 and 2022, respectively, due to drought.
Because the expected increase in cotton production is projected to exceed the increase in cotton use, ending stocks are projected to rise by over two million bales, up to 5.3 million bales (figure 2). As a result, the USDA projects cotton prices to decrease to an average of 68 cents per lb. for the 2024/2025 marketing year.
Peanuts
Peanut acreage is expected to increase by 7 percent compared to last year, totaling 1.65 million acres nationwide. Alabama is expected to plant 170 thousand peanut acres, down 3 percent from 2023. Nationwide, peanut production is expected to increase by 8 percent to 3.17 million tons. While peanut disappearance is expected to increase too, it is not projected to keep up with supply, leading to a 23 percent increase in ending stocks up to 1.2 million tons. As a result, the 2024/2025 marketing year peanut price is projected to drop to $510 per ton.
Grain Crops

Figure 3. Corn Prices and Stock-to-Use Ratio by Marketing Year
There have been sizable changes to the grain situation this year, with overall shifts from corn to soybeans. Farmers planted an estimated 91.5 million corn acres nationwide in 2024, a 3.3 percent decline from last year. In contrast, soybeans increased by 3 percent to 86 million acres. In Alabama, corn acreage is up 3 percent to 340 thousand acres, while soybean acres are identical to last year’s 350 thousand acres.
Figures 3 and 4 show the relationship between crop price and the stock-to-use ratio, a measure of how supplies compare to demand, for corn and soybeans. When the stock-to-use ratio is low, or demand is high relative to supply, prices tend to be higher as shown on the blue line. However, as the green bars get larger and supplies increase relative to demand – as is expected this upcoming marketing year – prices tend to drop. This pattern is reflected in both corn and soybeans. As a result, soybean prices are expected to decrease to $11.10 per bushel for the 2024/2025 marketing year, on average, while corn prices are projected to drop to $4.30.
However, the largest expected market shift is for wheat. Wheat production is projected to increase by 10 percent from last year due to both higher yields and area harvested. As a result of increased ending stocks, 2024/25 marketing year wheat prices are projected to drop by $0.80 from June’s prediction to $5.70 per bushel.
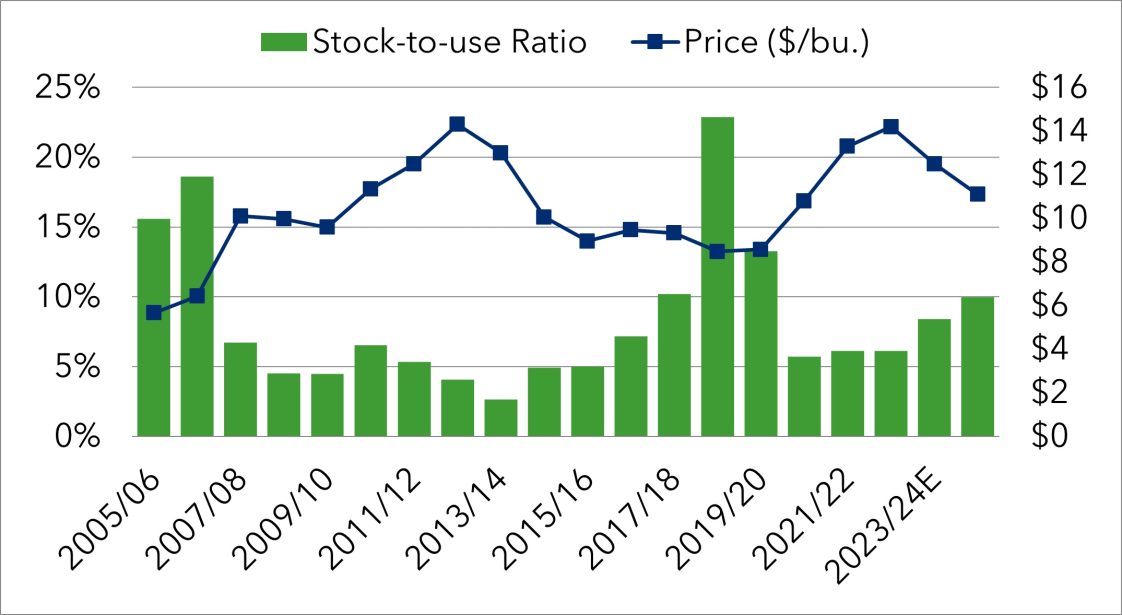
Figure 4. Soybean Prices and Stock-to-Use Ratio by Marketing Year
Takeaways
As crop prices fall and profit margins tighten, it will be even more crucial to develop a marketing plan and maximize prices received for crops. For more information on marketing tools available to row-crop producers, an online course is available on the Alabama Cooperative Extension System website: https://aces.catalog.auburn.edu/courses/marketing-tools-for-row-crop-producers
More Information
USDA-NASS. World Agricultural Supply and Demand Estimates. July 12, 2024. Available at: https://www.usda.gov/oce/commodity/wasde/wasde0724.pdf
USDA-NASS. Acreage. June 28, 2024. Available at: https://downloads.usda.library.cornell.edu/usda-esmis/files/j098zb09z/b2775k600/dv141h86n/acrg0624.pdf
USDA-ERS. Oil Crops Outlook. July 2024. Available at: https://www.ers.usda.gov/webdocs/outlooks/109543/oiltables.xlsx?v=2689.2