Crop Production
The first half of 2025 saw crop prices continue to trend downward. Production costs are lower in 2025 compared to last year, but the low crop prices left a lot of questions as to what would be planted and how markets would be affected. The US Department of Agriculture’s Acreage Report and July World Agricultural Supply and Demand Estimates provide further guidance on what production may look like this year and how that may affect prices for the upcoming 2025/26 marketing year.
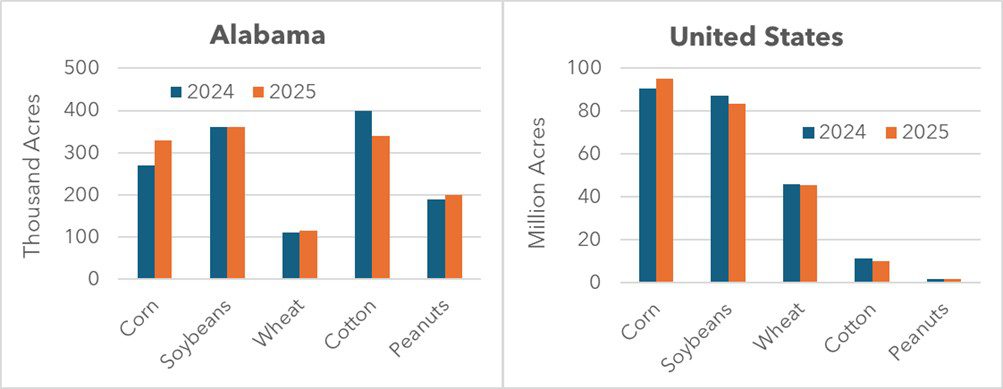
Figure 1: Alabama & U.S. Crop Acres, 2024 vs. 2025
Cotton
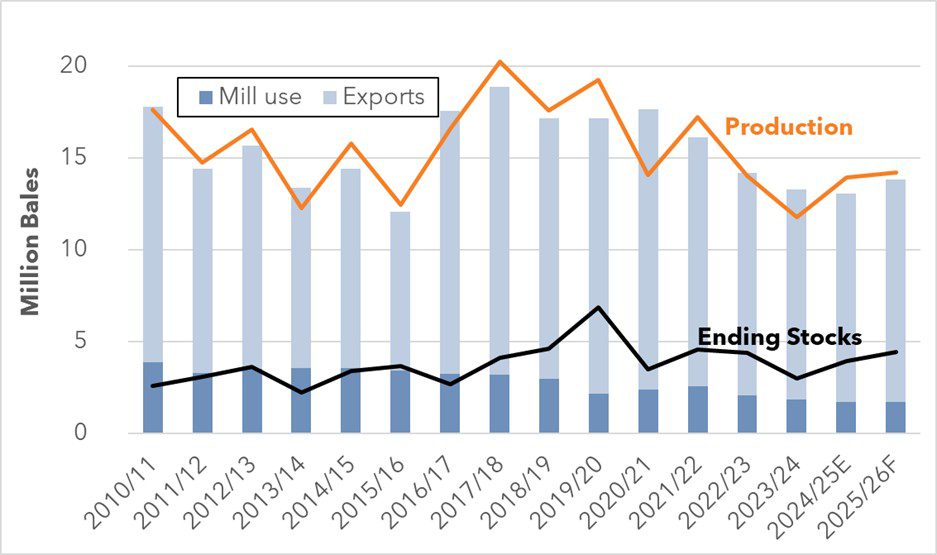
Figure 2: Cotton Supply, Demand, and Ending Stocks by Marketing Year
Alabama planted an estimated 340,000 cotton acres, according to the June report. This marks a 60,000 acre, or 15% decrease, from what was planted in 2024. This reflects the downward national trend in cotton acreage, as the US had a 9.5% decline in cotton planted acreage.
Surprisingly, the decrease in acreage is not expected to lead to a decrease in cotton production. This is due to a higher projected harvested area in 2025 than in 2024. Last year, only 70% of planted cotton acres were harvested, and this value is expected to increase to 86%. This is likely due to a lower proportion of the cotton area being in drought compared to last year.
The slight increase in cotton production is expected to surpass cotton use. This would result in a slight increase in ending stocks, up to 4.4 million bales (Figure 2). As a result of the increased supplies, the USDA projects upland cotton prices to decrease to an average of 62 cents per lb. for the 2025/26 marketing year.
Peanuts
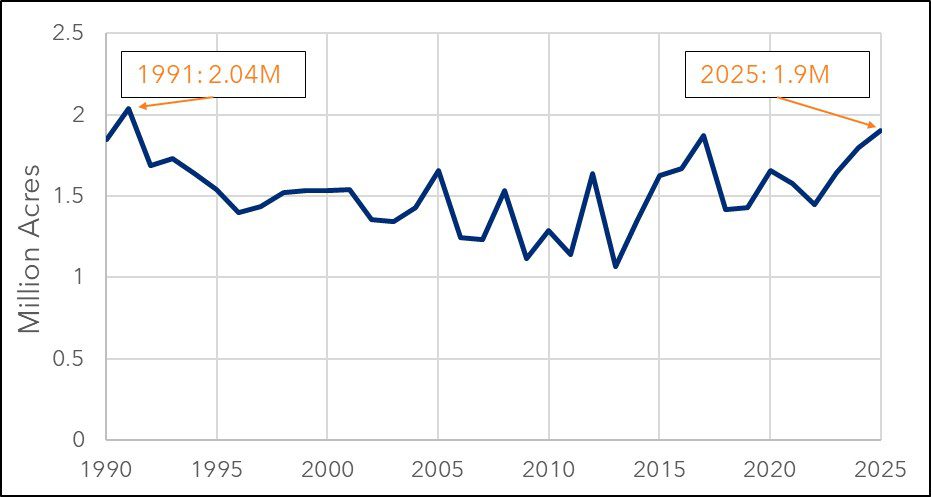
Figure 3: US Planted Peanut Acres by Year
Peanut acreage increased by 5% compared to last year, totaling 1.9 million acres nationwide. That would be the highest value since 1991 (Figure 3). Alabama is expected to plant 200,000 peanut acres, up 5% from 2024. Nationwide, peanut production is expected to increase to 3.7 million tons, an increase of 476,000 tons above the 2024 amount. At this level of production and current disappearance projections, 2025/26 marketing year ending stocks are projected to be 1.129 million tons, a 34% increase from the prior year. This expected increase in peanut supply would likely lead to a decline in peanut contract prices going into next year. Overall, the USDA-ERS projects peanut prices for the 2025/26 marketing year to average $500 per ton, which is in-line with the runner contracts offered this spring and would mark an $18 per ton decrease from last year.
Grain Crops
There have been sizable changes to the grain situation this year, with overall shifts from soybeans to corn. Farmers planted an estimated 94.6 million corn acres nationwide in 2025, a 5.1% increase from last year. In contrast, soybeans decreased by 4.2% to 83.4 million acres. In Alabama, corn acreage is up 22% to 330,000 acres, while soybean acres are identical to last year’s 360,000 acres.
Figures 4 and 5 show the relationship between crop price and days-on-hand, a measure of how long it would take to use up ending stocks if disappearance continued at the current pace for corn and soybeans. When the days-on-hand are low, or demand is high relative to supply, prices tend to be higher as shown on the blue line. This is what is forecast to happen with soybeans this year. However, as the green bars get taller and supplies increase relative to demand – as is expected this upcoming marketing year for corn – prices tend to drop. As a result, the average soybean price is expected to increase slightly to $10.10 per bushel for the 2025/26 marketing year, while corn prices are projected to drop to $4.20.
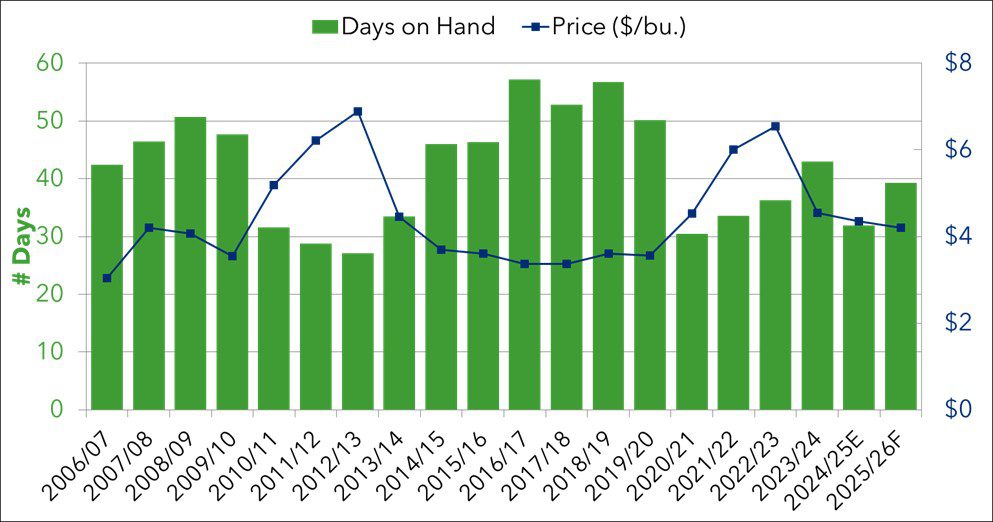
Figure 4: Corn Prices and Days-on-hand by Marketing Year
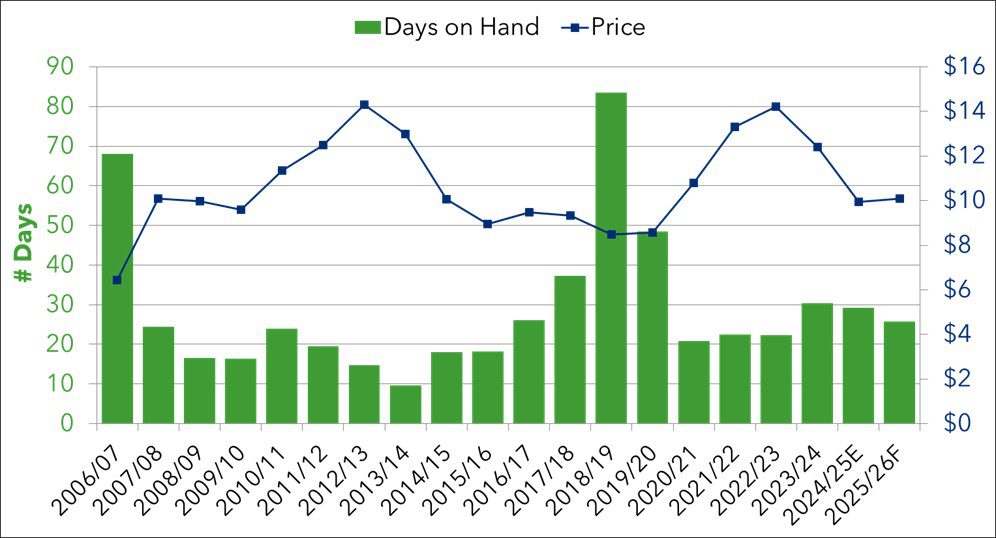
Figure 5: Soybean Prices and Days-on-hand by Marketing Year
Takeaways
As crop prices remain low and profit margins tight, it will be even more crucial to develop a marketing plan and maximize prices received for crops. Therefore, benefiting from market rallies that occur within the year will be necessary to obtain above average marketing-year prices. For more information on marketing tools available to row-crop producers, an online course is available on the Alabama Cooperative Extension System website. The course can be accessed by clicking here.
Summer 2025 Row Crop Outlook
| Row Crop Type | 2023/24 | 2024/25 Estimated | 2025/26 Projected | July 28, 2025 Closing Price |
|---|---|---|---|---|
| Cotton ($/cwt) | 76.10 | 63.00 | 62.00 | 68.34 Dec. '25 |
| Peanuts ($/ton) | 538 | 518 | 500 | NA |
| Soybeans ($/bu) | 12.40 | 10.00 | 10.10 | 10.12 Nov. '24 |
| Corn ($/bu) | 4.55 | 4.30 | 4.20 | 3.94 Sept. '25 |
References
- USDA-NASS. World Agricultural Supply and Demand Estimates. July 11, 2025. Available at https://www.usda.gov/about-usda/general-information/staff-offices/office-chief-economist/commodity-markets/wasde-report
- USDA-NASS. Acreage. June 30, 2025. Available at https://downloads.usda.library.cornell.edu/usda-esmis/files/j098zb09z/4455bc157/6q184j42c/acrg0625.pdf
- USDA-ERS. Oil Crops Outlook. July 15, 2025. Available at https://www.ers.usda.gov/publications/pub-details?pubid=112915
- USDA. Upland and Extra Long Staple Cotton Estimates. Available at https://www.usda.gov/sites/default/files/documents/uplelsJULY2025.xlsx