Forestry
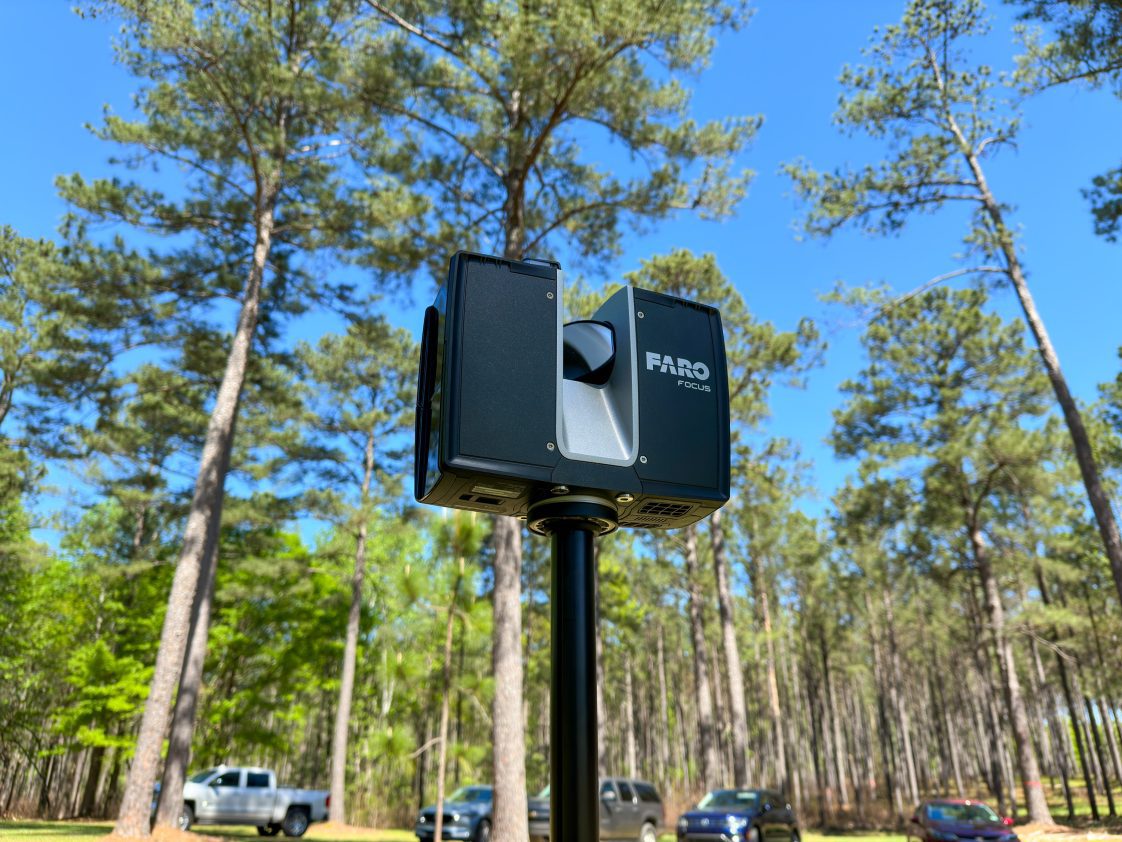
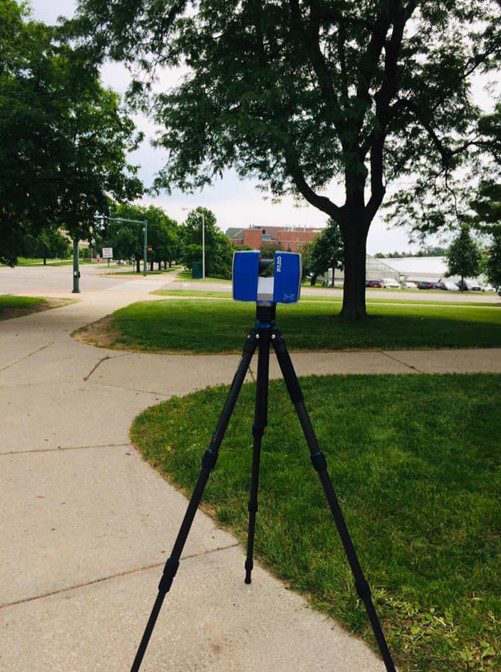
Figure 1. The FARO Focus 3D terrestrial laser scanner is available in the Urban Forestry lab at the College of Forestry, Wildlife, and Environment at Auburn University. The scanner head is mounted on a tripod.
Accurate quantification of urban forest carbon stocks is required for cities to participate in forest carbon markets. Traditional methods for estimating the carbon content of trees often require tree harvesting, which can be impractical or not applicable in urban settings. This Extension publication is part of a series with the goal of presenting a novel, nondestructive approach for carbon content quantification using terrestrial laser scanning technology.
Nondestructive Quantification of Urban Forest Carbon Stocks Using Terrestrial Laser Scanning
The total aboveground biomass (AGB, measured in pounds or kilograms) of a tree is defined as the total dry mass (i.e., at 0 percent moisture content) allocated to the live and dead tissues and organs of the aboveground tree structure (stems, branches, leaves, etc.). Approximately 45 to 50 percent of a tree’s biomass is carbon content, and, therefore, we can indirectly estimate the aboveground carbon stocks of urban trees by estimating their AGB.
Terrestrial laser scanning (TLS) provides a nondestructive approach for quantifying tree woody volume without harvesting trees, which can be converted to AGB and carbon estimates. This technology alleviates the problem of tree harvesting to create equations for urban forest carbon estimation. All required data are collected on standing trees regardless of their size or species, and trees do not need to be harvested.
TLS is an active remote sensing technique where the sensor is mounted on a tripod (figure 1). It emits millions of laser pulses per second to capture the three-dimensional structure of the surrounding environments by creating three-dimensional “point clouds” (figure 2). Several studies have successfully used TLS to measure diameter at breast height (DBH), total height, and stem form of trees on rural forest plots. Other studies have used TLS to accurately analyze rural forest trees’ aboveground woody volume, biomass, and carbon content allocation. Previous studies have also used TLS to estimate the biomass and carbon content of urban trees, showing high accuracy.
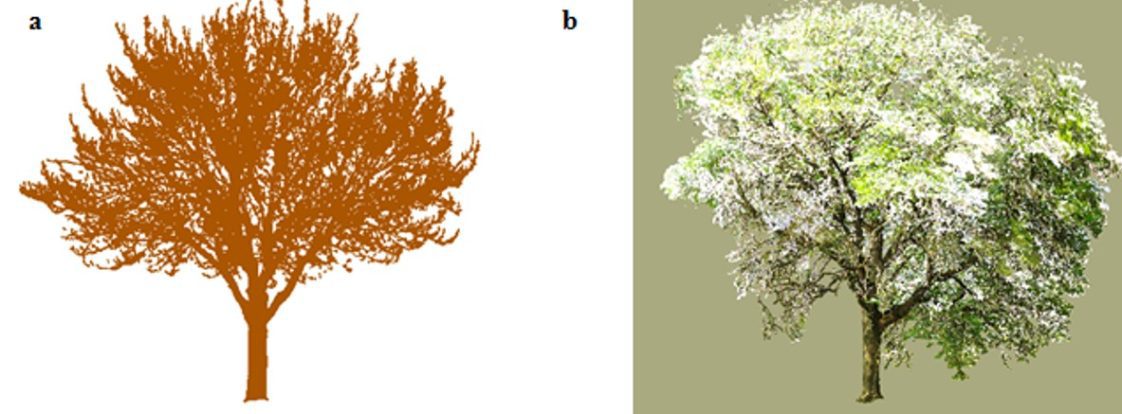
Figure 2. Digital representations of (a) the laser point cloud of an urban red maple (Acer rubrum) tree that was laser scanned without leaves (the point cloud has been artificially colored brown and consists of eight million laser points); (b) the laser point cloud of an urban honey locust (Gleditsia triacanthos) tree that was laser scanned during the leaf on period (the point cloud consists of twenty million laser points). These point clouds depict tree structure in great detail in three dimensions (although they are presented in two dimensions here).
After a tree is scanned with the terrestrial laser scanner and a point cloud has been created, a model tree structure is created by fitting cylinders into the point cloud (figure 3). There are algorithms that automatically fit those cylinders, capturing tree structure and tapering stems and branches. The abovementioned algorithms also provide volumes of the cylinders and thus the total woody volume of a tree (simply by adding together all cylinder volumes).
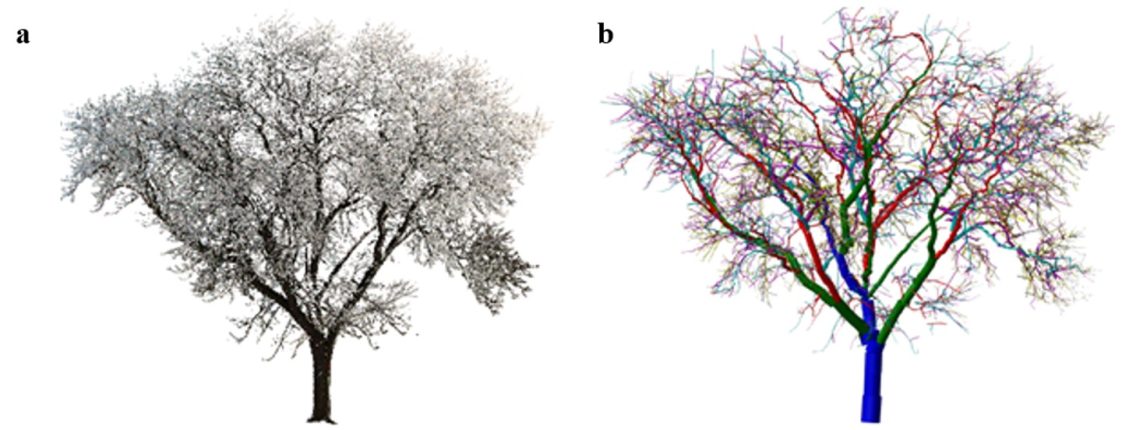
Figure 3. Digital representation of an urban honey locust (Gleditsia triacanthos) tree showing (a) the laser point cloud without leaves; (b) the generated tree model with cylinders fitted to the point cloud. Cylinder colors denote different tree parts (i.e., blue is main stem, green is first order branches attached to the main stem, red is second order branches attached to the first order branches, etc.).
The total AGB of urban trees can be estimated without harvesting them, if the total aboveground woody volume of the trees estimated from TLS data is multiplied with the density of the wood. Some publicly available databases provide wood density values for different species. Alternatively, increment woody cores can be derived from individual trees to quantify their wood density in the lab. Finally, the carbon content of an urban tree can be estimated at 50 percent of its woody biomass quantified with TLS technology.
Conclusions
TLS technology provides nondestructive estimates of AGB and carbon content of urban trees in large spatial scales in a time-efficient manner while no tree harvesting is required. A trained professional is needed to operate the scanner and analyze the data. The scanner operator needs to be trained to scan trees to capture high-quality data to obtain a complete three-dimensional image of trees. Equipment cost can vary depending on its technical characteristics (e.g., $50,000 to $100,000), making it more suitable for private and public institutions conducting extensive urban forest inventories.
Suggested Literature
- Arseniou, G., MacFarlane, D.W., Calders, K. &Baker, M. (2023) Accuracy differences in above-ground woody biomass estimation with terrestrial laser scanning for trees in urban and rural forests in different leaf conditions. Trees: Structure andFunction 2023, DOI:10.1007/s00468-022-02382-1.
- Burt, A., Boni Vicari, M., da Costa, A.C.L., Coughlin, I., Meir, P., Rowland, L. & Disney, M. (2021) New insights into large tropical tree mass and structure from direct harvest and terrestrial lidar. Royal Society Open Science 8: 201458. DOI: 10.1098/rsos.201458.
- Calders, K., Newnham, G., Burt, A., Murphy, S.,Raumonen, P., Herold, M., Culvenor, D., Avitabile, V.,Disney, M.I., Armston, J. & Kaasalainen, M. (2015) Nondestructive estimates of above-ground biomass using terrestrial laser scanning. Methods in Ecology and Evolution Vol. 6 (2015), p. 198-208.
- Kükenbrink, D., Gardi, O., Morsdorf, M., Thürig, E., Schellenberger, A. & Mathys, L. (2021) Above-ground biomass references for urban trees from terrestrial laser scanning data. Annals of Botany XX: 1-16, 2021. https://doi.org/10.1093/aob/mcab002.
- Miles, P.D., Smith, W.B. (2009) Specific gravity and other properties of wood and bark for 156 tree species found in North America. Res. Note NRS-38. Newtown Square, PA: U.S. Department of Agriculture, Forest Service, Northern Research Station, p 35.
 Georgios Arseniou, Extension Specialist, Assistant Professor, Forestry, Wildlife, and Environment, Auburn University
New April 2024, Quantification of Urban Forest Carbon Stocks Using Terrestrial Laser Scanning Technology, FOR-2159