Forestry
Although an array of forest sampling techniques are available to land managers, the use of fixed-radius plots (FRPs) for forest inventories is common in southern forests.
Fixed-radius plots are usually circular with plot sizes commonly reported in fractions of acres (1/10 acre, 1/20 acre, etc.). Size and number of plots used in a forest inventory will vary depending on the desired sampling intensity, average tree size, and spacing of trees within the stand.
In an attempt to capture forest variability, fixed-radius plots are typically located systematically along compass lines that are evenly distributed across a stand. At each plot location, the predetermined plot radius is measured from plot center to surrounding trees using a measuring tape (figure 1). All trees within the radius are considered to be in the plot and are sampled accordingly for attributes such as tree count, species, diameter, and height.
Naturally, some trees are going to be only partially within the desired radius. In these situations, the tree is included and measured as long as at least half of the bole (main stem) falls within the plot boundary (figure 2). Trees that lie beyond the plot boundary are considered out and are not counted.
-
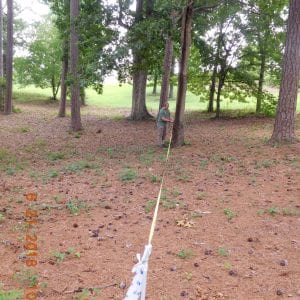
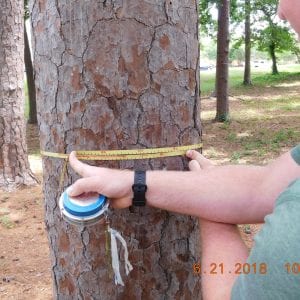
- Figure 1. View from plot center. When measuring out your fixed-radius plot, stretch your tape out to the appropriate plot radius and systematically determine which trees fall within your plot. Plot size should based on the composition of the stand you are measuring.
-
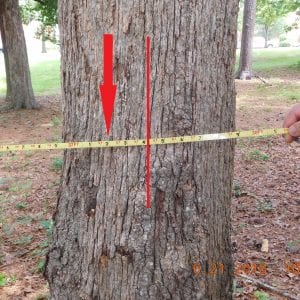
- Figure 2. Example of out tree. Here, we see that the 37.2-foot plot diameter limit (represented by the red arrow) does not reach the midpoint of the main stem of this tree (represented by the red line). This tree is considered to be out and is not recorded.
Calculating Plot Radius for a Fixed-Radius Circular Plot
Calculating the appropriate radius length for fixed-radius plots can seem like a daunting task, but it can be as simple as entering the right sequence of equations into your pocket calculator. The math behind calculating plot radius relies on geometry, specifically the area of a circle. The formula for the area of a circle is as follows:
Equation 1: A = πr2: in which A = plot area, π = pi or 3.14, and r = plot radius.
With this formula, you can work backward from the desired plot size by calculating the area of the desired fraction of an acre. Because there are 43,560 feet2 in an acre, divide 43,560 by the desired plot size to calculate the area of a single plot. Then reverse equation 1 to calculate plot radius. Example:
Desired plot size = 1/10 acre
43,560 feet2/acre /10 = 4,356 feet2/acre in 1/10-acre plot
4,356 = πr2
4,356/3.14 = r2 = 1,386.56 feet2
√(1,386.56) = r = 37.2 feet
1/10-acre plot radius = 37.2 feet
Benefits of Fixed-Radius Plots
Fixed-radius plots are often used because they can be completed by a small crew or even just one person, are not significantly influenced by understory vegetation, and allow for simple calculations to summarize stand data (table 1). For example, forest managers can calculate trees per acre (TPA), a common measure of stand density, by multiplying the number of trees measured within a plot by the plot size. (Example: 10 trees measured in a 1/10-acre plot would represent 100 trees per acre). Other metrics, such as stand basal area, can be calculated using similar methods, and then, by averaging those calculations across plots a representation of overall stand condition is generated. For more information on basal area, see Alabama Extension publication ANR-1371, “Basal Area: A Measure Made for Management.”
Drawbacks of Fixed-Radius Plots
Though they can be completed by just one person in even the densest understory conditions, FRPs are generally considered to be somewhat time consuming, especially when larger plots are utilized (table 1). This stems from the observer’s measuring every tree within the desired radius, regardless of tree size. For example, when sawtimber volume estimates are the objective, small diameter trees measured within FRPs can add considerable time while contributing little to these estimates. To combat this, establishing tree diameter limits that follow desired product classes can ensure that only trees of a certain minimum size are measured.
Smaller plot sizes may also increase efficiency in dense stands; however, more plots are often needed to achieve the required sampling intensity. A good rule of thumb is to use a plot size that encompasses around 5 to 10 trees per measurement plot.
Table 1. Summary of Fixed-Radius Plots and Overview of Strengths and Weaknesses
| Description | Common Tools Needed | Strengths | Drawbacks |
|---|---|---|---|
| Relies on random or systematically developed plot centers. Each plot has a predetermined (fixed) radius within which individual trees are measured for things such as diameter and height. |
Choosing a Sampling Method Based on Objectives
A study comparing the time to implement fixed and variable-radius plots in second growth, natural loblolly pine stands in the Piedmont physiographic region in Georgia found that 1/10- and 1/20-acre plots provided the most cost-effective sampling scheme for determining board-foot volume. Though 1/5-acre plots were the most accurate, the increased time did not justify the marginal accuracy improvements. For board-foot volume estimates, variable-radius plots using a BAF-10 wedge prism resulted in error rates greater than 12 percent, suggesting that, though faster than 1/10-acre fixed-radius plots, the increased error rate negates many perceived benefits.
Foresters and other land managers should determine plot size based on the desired sampling intensity of the stand and stand composition. Large plots cover more area and therefore require fewer plots to achieve the same sampling intensity. However, they may add significant time to each plot, especially when there are many trees to measure. Alternatively, smaller plots are faster, but more plots are necessary to ensure adequate coverage of the stand. Plot size can have implications on both the cost and accuracy of the inventory, demonstrating the importance of matching the appropriate plot size to each stand.
-
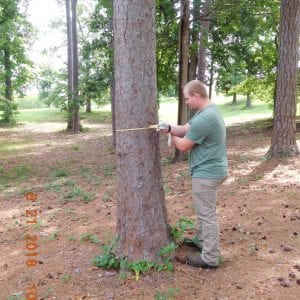
- Figure 3. To measure the diameter of a tree at breast height, begin by locating where breast height (4½ feet) is for you. Then, measure the tree at that height from the uphill-side of the tree.
-
- Figure 4. When measuring the diameter at breast height, read where the zero line lines up with the rest of the tape when pulled around the tree. In this example, the tape aligns closely with the 16.4-inch mark, meaning that this tree has a DBH of 16.4 inches.
Download a PDF of Fixed-Radius Plots as Inventory Method in Southern Forests, FOR-2060.